
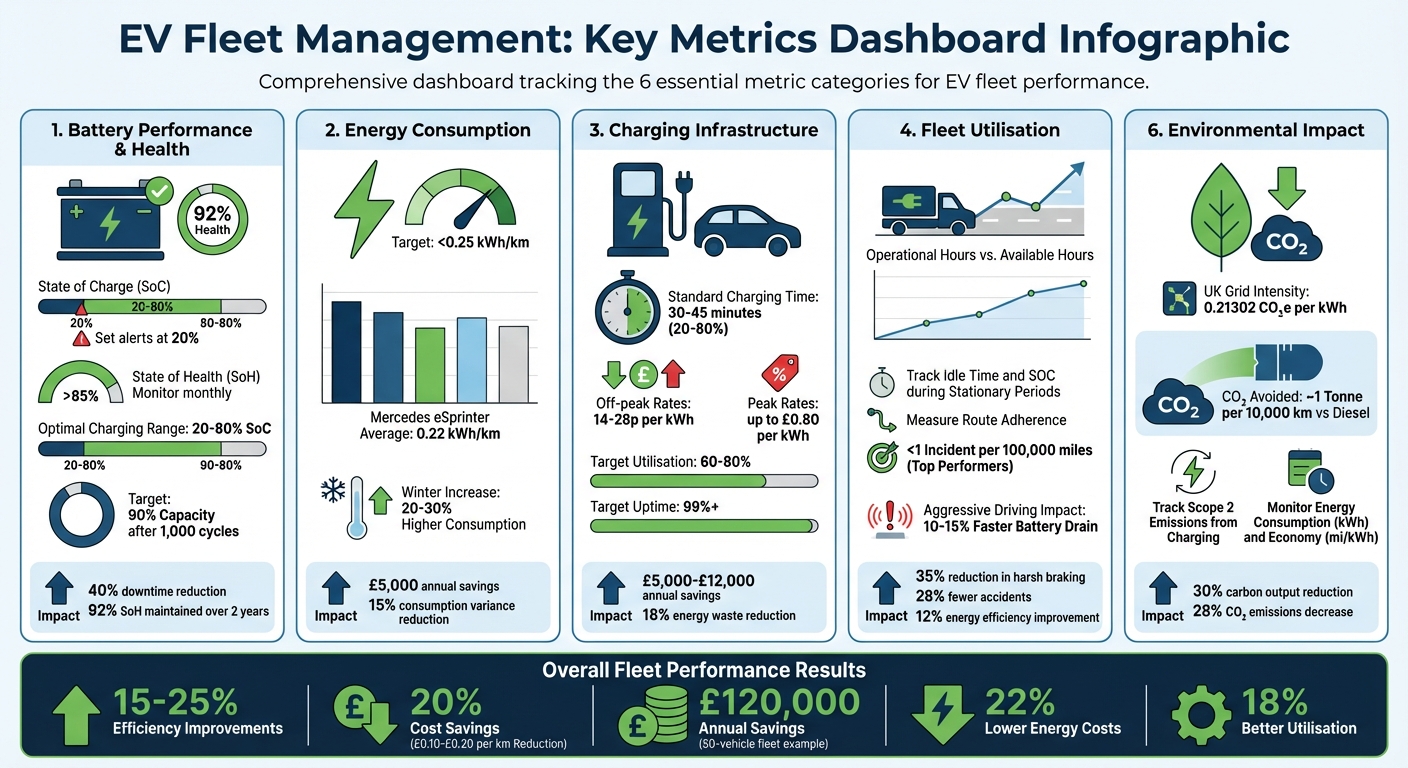
Fleet-Wide EV Data: Key Metrics to Track
Tracking the right EV fleet metrics — battery health, energy use, charging, utilisation and driver behaviour — cuts costs, boosts uptime and lowers emissions.

Managing an EV fleet successfully comes down to tracking the right metrics. From battery performance to charging efficiency, the data you monitor can directly impact costs, uptime, and sustainability goals. Here's a quick summary of the most important metrics to focus on:
- Battery Health: Monitor State of Charge (SoC) and State of Health (SoH) to avoid downtime and extend battery life.
- Energy Use: Track kWh per km to optimise routes and cut costs, especially during seasonal changes.
- Charging Metrics: Measure average charging time, cost per kWh, charger utilisation, and uptime to ensure smooth operations.
- Fleet Utilisation: Analyse vehicle usage, idle time, and route adherence to maximise productivity and reduce empty miles.
- Driver Behaviour: Use telematics to identify and improve harsh driving, reduce accidents, and save energy.
- Environmental Reporting: Calculate CO₂ emissions avoided and track energy consumption for accurate reporting.
Essential EV Fleet Metrics: Key Performance Indicators to Track
Exploring Telematics - a data driven approach to EV fleets
sbb-itb-499a7f0
Battery Performance and Health Metrics
Keeping track of battery performance comes down to two critical metrics: State of Charge (SoC) and State of Health (SoH). SoC reflects the battery's current charge level as a percentage, while SoH measures how much the battery has degraded over time. For example, fleet managers covering long UK routes, such as the M25, often set SoC alerts at 20%. This ensures drivers have enough time to reach a charging station without unnecessary interruptions. On the other hand, monthly SoH checks can identify batteries that drop below 85% capacity, signalling when maintenance might be needed.
State of Charge and Battery Health
A logistics company in Manchester, managing 30 electric vehicles (EVs), introduced SoC alerts and saw downtime reduced by 40%. At the same time, their SoH remained above 92% over two years. For a typical 150 km journey through London, setting a 30% SoC alert provides a comfortable margin for a brief 15-minute detour to a public charger. Charging at these locations costs around £0.40 per kWh.
Battery degradation tends to follow predictable patterns. For instance, lithium-ion batteries in vehicles like the Ford E-Transit lose around 2–3% capacity each year under heavy use. Regular SoH monitoring can extend the battery's lifespan, potentially exceeding 200,000 km. To maintain battery health and maximise uptime, fleet operators are encouraged to charge within the 20–80% SoC range. This approach can help retain about 90% of the battery's capacity even after 1,000 charge cycles, a practice endorsed by the UK EV Fleet Association.
Once battery performance is under control, the next step is to focus on energy consumption metrics to optimise overall fleet efficiency.
Energy Consumption Metrics
Energy consumption, typically measured in kWh per km, is a key indicator of vehicle efficiency. For UK fleets, keeping this figure below 0.25 kWh/km is ideal. As an example, the Mercedes eSprinter averages around 0.22 kWh/km on urban routes. Comparing individual vehicle performance against a fleet average - such as 180 Wh/km for light vans - can help identify outliers that may need driver training or maintenance.
Seasonal changes also play a big role. During UK winters, when temperatures hover between 0–5°C, energy consumption can rise by 20–30%. In one instance, a London courier fleet managed to cut consumption variance by 15% through targeted driver training, resulting in £5,000 in annual energy savings. By analysing historical data based on factors like route, load, and season, fleet managers can make more accurate forecasts. For example, a fleet of 50 vans averaging 0.20 kWh/km over 200 km daily would require around 2,000 kWh per day. Scheduling charging during off-peak hours at £0.10/kWh could trim costs by 40% compared to peak rates.
Telematics tools, such as GRS Fleet Telematics, provide real-time data on battery performance and energy consumption. These insights are invaluable for improving fleet efficiency and extending the lifespan of vehicles.
Charging Infrastructure and Energy Management Metrics
After examining battery and energy usage, charging metrics add another layer of insight into fleet efficiency. For effective EV fleet management, tracking charging times and charger performance is crucial. These metrics directly influence operating costs and fleet availability, making them indispensable for fleet managers. When combined with battery and driver performance data, they provide a comprehensive picture of operations.
Average Charging Time and Cost per kWh
Average charging time reflects how efficient charging sessions are. To calculate this, divide the total session duration by the number of sessions. For UK fleets using 50 kW DC fast chargers, the standard charging time from 20% to 80% is typically 30–45 minutes. If sessions exceed this range, it could point to issues like battery preconditioning failures or mismatches between the vehicle and charger.
The cost per kWh is another key factor and can vary widely depending on the time of charging. In the UK, off-peak rates - such as those offered by Octopus Energy - range from 14–28p per kWh, while peak rates can go as high as £0.80 per kWh. For example, a fleet of 50 vehicles shifting 70% of its charging to off-peak hours could save around £5,000 annually. To determine the actual cost, divide total energy expenses by the total kWh charged, and break this down further by time-of-use tariffs. It's also important to account for the 5% VAT applied to EV charging in the UK.
One logistics company in the UK reviewed its charging data and discovered that sessions were averaging 45 minutes, exceeding the benchmark. By addressing these inefficiencies, they reduced the average charging time to 30 minutes, cut dwell times by 20%, and improved vehicle turnover [4,6].
Charger Utilisation and Uptime
Charger utilisation measures how often chargers are in use. UK fleet operators generally aim for utilisation rates between 60% and 80%. If utilisation exceeds 80%, it may indicate that the infrastructure is nearing capacity, suggesting the need for expansion [3,7]. On the other hand, low utilisation could signal over-provisioning or scheduling problems.
Uptime reflects charger reliability and is calculated as (operational hours ÷ total available hours) × 100. The target is 99% or higher. Falling below this benchmark can lead to significant costs - for instance, an idle charger at a 20-bay depot could cost between £200 and £500 daily in lost productivity [5,8]. Predictive maintenance has proven effective in UK trials, helping fleets keep downtime under 1% [5,8].
A London-based delivery fleet, for instance, identified a 95% utilisation rate, revealing bottlenecks during peak hours. By adding four 22 kW chargers and using app-based scheduling, they achieved a 99.2% uptime, reduced energy waste by 18%, and saved £12,000 annually [4,6]. Tools like GRS Fleet Telematics offer real-time data, enabling proactive management of charging infrastructure and better cost control.
Fleet Utilisation and Efficiency Metrics
Understanding how vehicles are used plays a key role in cutting costs and boosting productivity. Fleet utilisation metrics shed light on how assets are deployed, helping managers make informed decisions to get the most out of their investments.
Vehicle Utilisation and Idle Time Tracking
Vehicle utilisation measures how much time each vehicle spends in active use compared to its total available time. This is typically calculated by dividing operational hours by total available hours and multiplying the result by 100. For electric vehicles (EVs), tracking idle time requires a slightly different approach since EVs still consume power for HVAC systems and electronics even when stationary.
To manage this, monitor the state of charge (SOC) during idle periods and disable non-essential systems for stops lasting more than 10 seconds - unless safety concerns in heavy traffic require otherwise. For fleets with specialised vehicles, auxiliary lithium-ion systems can provide necessary power without draining the main battery.
Tools like GRS Fleet Telematics offer real-time tracking to distinguish between driving time and stationary periods. This data allows fleet managers to make adjustments, such as reallocating underused vehicles, tweaking shift schedules, or even resizing the fleet. Additionally, analysing driving behaviours can provide further insights into improving efficiency.
Route Adherence and Empty Miles
Route adherence measures how closely drivers stick to their planned routes. While occasional detours may be unavoidable due to traffic or customer needs, frequent deviations can signal inefficiencies or unauthorised stops. Monitoring this metric ensures drivers follow energy-efficient routes, which is especially important for EV fleets where range management is a priority.
Empty miles - also known as deadhead miles - refer to trips made without carrying cargo or passengers. These often occur when vehicles return to a depot after completing deliveries or travel between assignments. Reducing empty miles can significantly enhance efficiency and cut energy costs. By calculating empty miles as a percentage of total miles, fleet managers can identify areas that need improvement and make targeted adjustments.
Driver Behaviour and Safety Metrics
How drivers handle electric vehicles (EVs) has a direct effect on safety, operational costs, and battery health. Using telematics to monitor driving behaviour gives fleet managers insights that can help reduce accidents, lower energy consumption, and extend the life of vehicles.
Driver Scores and Behaviour Analysis
Telematics systems evaluate specific driving habits to produce driver scores, often on a scale of 100. These scores are based on metrics such as harsh acceleration (e.g., reaching full throttle in under two seconds), harsh braking (deceleration exceeding 0.5g), speeding (driving over the limit by more than 5 mph), and excessive idling. Data is typically collected and analysed over a rolling 30-day period, with each behaviour weighted accordingly.
For example, in 2022, DHL UK equipped 5,000 EV vans with telematics. This move reduced harsh braking by 35% and accidents by 28%, thanks to targeted coaching. The initiative also improved energy efficiency by 12% and saved £450,000 annually, as reported in the DHL Sustainability Report 2023. Similarly, from Q1 to Q3 2023, Tesco Fleet implemented Verizon Connect telematics across 2,800 EVs. This programme, spearheaded by Safety Director Lisa Grant, included weekly driver score feedback, which led to a 42% drop in speeding incidents, a 22% reduction in overall accidents, and a 15% cut in insurance premiums [Verizon Connect Case Study, October 2023].
Aggressive driving not only increases accident risks but also affects battery performance. It can drain batteries 10–15% faster, reduce range by 20–30 miles per charge, and accelerate yearly capacity loss by an extra 2%. On the flip side, optimising driving habits through telematics can extend battery life by up to 20% and keep vehicle uptime at 95%. Fleet managers can motivate safer driving by using tools like driver leaderboards and real-time app alerts for scores below thresholds (e.g., 75). This approach has been shown to improve performance by 22% within three months.
These driver behaviour insights also feed into monitoring incident rates, helping identify areas where safety measures can be strengthened.
Accident and Incident Rates
Analysing accident and incident rates based on driver performance data can uncover trends that inform safety strategies. For UK EV fleets, the average is 1.5 incidents per 100,000 miles, though top-performing fleets achieve rates below 1. Key metrics include the total number of incidents, severity levels (minor, major, or fatal), near-misses flagged by advanced driver-assistance systems (ADAS), and incident rates per driver or mile travelled.
For instance, data often shows a 40% rise in collisions during peak hours or increased risks at urban roundabouts. Regularly reviewing incident data can highlight patterns, such as a 15% increase in braking incidents, which could lead to route changes or targeted driver training. In one UK logistics fleet of 50 EVs, telematics identified that the most aggressive 10% of drivers were responsible for 25% of excess energy use, costing £2,500 per month at 15p per kWh. After targeted training, harsh driving events dropped by 40%, saving £15,000 annually and preventing two minor collisions.
Lowering accident rates also reduces downtime and repair costs, which can range from £1,200 to £5,000 per incident. Fleets using advanced solutions like GRS Fleet Telematics, which offers dual-tracker technology for just £7.99 per month and boasts a 91% stolen vehicle recovery rate, have achieved accident rates 25% below industry averages while maintaining robust safety monitoring.
Environmental Impact and Reporting Metrics
Monitoring environmental performance has become a necessity for UK fleets. Today, stakeholders, regulatory bodies, and corporate sustainability teams demand detailed data on how electric vehicle (EV) operations contribute to reducing carbon emissions. This reporting goes beyond efficiency insights, offering a complete picture of a fleet's environmental contributions.
CO₂ Emissions Avoided
To measure avoided emissions, EV fleet energy usage is compared against benchmarks for internal combustion engine (ICE) vehicles. While EVs eliminate Scope 1 emissions (direct tailpipe emissions), fleet managers must also track Scope 2 emissions, which stem from the electricity used for charging. Telematics systems play a key role here, collecting data such as distance travelled and daily energy consumption. These metrics allow managers to calculate the carbon footprint of EV operations in comparison to ICE alternatives.
A critical factor in this calculation is grid intensity - measured as CO₂ equivalent per kWh. In the UK, the National Grid's average energy mix emits about 0.21302 CO₂ equivalent per kWh (factoring in grid losses). This figure is expected to improve as the grid moves towards 100% renewable energy by 2035. By using energy economy metrics, managers can compare EV performance with conventional vehicles and make more informed decisions to reduce Scope 2 emissions. Additionally, real-time data on battery charge and charging status helps optimise dispatching, reducing unnecessary mileage and further cutting emissions.
Fleet managers are encouraged to follow the GHG Protocol Corporate Standard for reporting Scope 2 emissions, covering both on-site and off-site charging. Incorporating factors like ambient temperature and air conditioning usage enhances the accuracy of emissions reporting.
Energy Consumption Reporting
Accurate energy consumption reporting is vital for demonstrating environmental accountability. Transparent reporting not only supports sustainability goals but also provides audit-ready data for corporate reports. Advanced van tracking solutions, such as those from GRS Fleet Telematics, give fleet managers real-time insights into energy usage across all charging locations, whether at depots, home bases, or public charging stations.
Automated systems track key metrics like total energy consumed (kWh), energy economy (mi/kWh), and charging duration. Monitoring State of Charge (SOC) changes through charge assurance dashboards can improve charging efficiency by over 160%.
Key metrics for effective energy consumption reporting include:
| Metric | Data Source | Role in Emission Reporting |
|---|---|---|
| Total Energy Consumed (kWh) | Charge Assurance Dashboard | Calculates Scope 2 emissions based on grid intensity |
| Energy Economy (mi/kWh) | EV Energy Usage Report | Benchmarks efficiency and identifies areas for emission reduction |
| Distance Travelled | Telematics/GPS | Provides data to calculate avoided Scope 1 emissions from ICE vehicles |
| Grid Intensity (CO₂e/kWh) | Government/Utility Data | Converts energy usage into CO₂ equivalent using local grid factors |
Real-time SOC data helps ensure the closest vehicle with sufficient range is dispatched, minimising extra mileage and energy waste. For fleets using Plug-in Hybrid Electric Vehicles (PHEVs), tracking battery usage versus fuel consumption is essential to ensure the vehicles operate primarily in electric mode to meet environmental goals.
An Electric Vehicle Suitability Assessment (EVSA) can verify that chosen EVs achieve the best energy efficiency. When combined with automated telematics data, this preparatory step creates a transparent reporting framework that satisfies both internal goals and external regulatory standards. Integrating environmental metrics with battery and driver data provides a well-rounded view of fleet performance.
Implementation and Monitoring Framework
To ensure your EV fleet performs at its best, a structured framework is crucial for tracking and evaluating key metrics in real time. This framework connects data collection directly to actionable strategies, ensuring that insights lead to meaningful operational improvements. By documenting data flow - from vehicles to analysis - and assigning clear responsibilities for metric review, you can avoid fragmented efforts and lost opportunities. This system ties seamlessly into earlier discussions on operational metrics, forming a bridge between raw data and effective fleet management.
Automated Reporting and Real-Time Monitoring
Automated systems play a vital role in reducing errors and providing instant visibility into fleet operations. Real-time monitoring is particularly useful for catching and resolving issues like charging station malfunctions or battery wear before they escalate into larger problems. Key features of these systems should include live tracking of vehicle locations, instant alerts for charging or safety issues, and automated notifications to keep managers ahead of potential disruptions.
Automated reports, generated at regular intervals, bring consistency to fleet management. Weekly reports should focus on operational details such as vehicle utilisation, idle time, and charging station uptime. Monthly reports, on the other hand, should provide a more strategic overview - tracking trends in battery health, comparing energy consumption patterns to previous months, and analysing cost per kWh. This combination of real-time alerts and scheduled reporting ensures both immediate and long-term insights are always accessible.
Benchmarking and Review Frequency
Routine reviews are essential for keeping your strategies aligned with evolving data. The frequency of these reviews should depend on the urgency of the metrics being tracked - daily for critical alerts, weekly for emerging trends, and monthly for benchmarking progress. This layered approach helps balance the need for actionable insights with the risk of overwhelming your team with too much information.
Benchmarking starts by establishing baseline metrics in areas like battery efficiency, charging costs, vehicle utilisation, and driver safety. These baselines should then be compared to industry standards and peer data to pinpoint areas for improvement. Internal benchmarking allows you to set realistic targets tailored to your fleet's unique characteristics, such as vehicle types, route patterns, or available charging infrastructure. External benchmarking, meanwhile, draws on industry reports, manufacturer data, and guidelines from local transport authorities to validate your performance goals. Conducting quarterly reviews ensures that progress is tracked consistently, with strategies adjusted as needed to meet evolving targets and trends.
Conclusion
Managing an EV fleet without keeping tabs on key metrics can lead to missed chances to cut costs, boost efficiency, and hit sustainability goals. The metrics discussed in this guide - like battery health, charging costs, driver behaviour, and CO₂ emissions avoided - are essential for effective, data-driven fleet management. When tracked together, they can deliver tangible results: 15-25% efficiency improvements, 20% cost savings (equating to a reduction of £0.10-£0.20 per kilometre), and notable environmental gains.
These aren't just theoretical benefits - they’re backed by real-world successes. For instance, a UK-based logistics company running 50 EVs applied comprehensive metric tracking and achieved 22% lower energy costs (£120,000 saved annually), 18% better utilisation, 35% fewer incidents, and a 28% reduction in CO₂ emissions. These improvements were the result of combining data on battery performance, charging efficiency, route planning, and driver behaviour.
The environmental impact is just as striking. Fleets that actively monitor emissions metrics have reported 30% drops in carbon output, aligning with the UK's net-zero goals for 2050 and enabling accurate ESG reporting. With each EV cutting around 1 tonne of CO₂ per 10,000 kilometres compared to diesel vehicles, even smaller fleets can make a big difference in reducing emissions while taking advantage of carbon credits.
To build on these performance and environmental metrics, successful fleet management requires real-time tracking, automated reporting, and consistent benchmarking. Establish clear baselines and regularly compare them against industry standards to spot and address underperformance. Immediate alerts paired with scheduled reports ensure you’re always ready to make informed decisions, adapting strategies quickly to tackle potential problems before they escalate.
FAQs
Which EV fleet metrics should I track first?
To get the most out of your EV fleet, begin by keeping an eye on crucial metrics such as battery health (both State of Charge and State of Health), energy consumption, and charging habits. Tracking these factors allows you to fine-tune fleet performance while managing expenses more efficiently.
How do I set the right SoC alerts for my routes?
To keep track of battery levels efficiently, use a telematics system that provides real-time monitoring. Set specific alert thresholds - like a minimum SoC percentage, such as 20% - to notify fleet managers or drivers when the battery level gets too low. It's a good idea to adjust these thresholds regularly, considering factors like route length and how the vehicle is being used. This approach helps maintain efficiency and prevents the risk of unexpected battery depletion.
How can I calculate CO₂ emissions avoided accurately?
To figure out how much CO₂ emissions are avoided, start by keeping a close eye on fuel consumption, driving habits, and vehicle efficiency through telematics. Once you have this data, use standard emission factors tied to fuel combustion to calculate the avoided emissions. Regularly tracking these details ensures accurate results and helps align with sustainability goals.