7 EV fleet KPIs for performance tracking
Monitor 7 EV fleet KPIs—battery health, range use, charging time, kWh/mile, downtime, trip efficiency and driver behaviour.
 By Michael Bar17 min read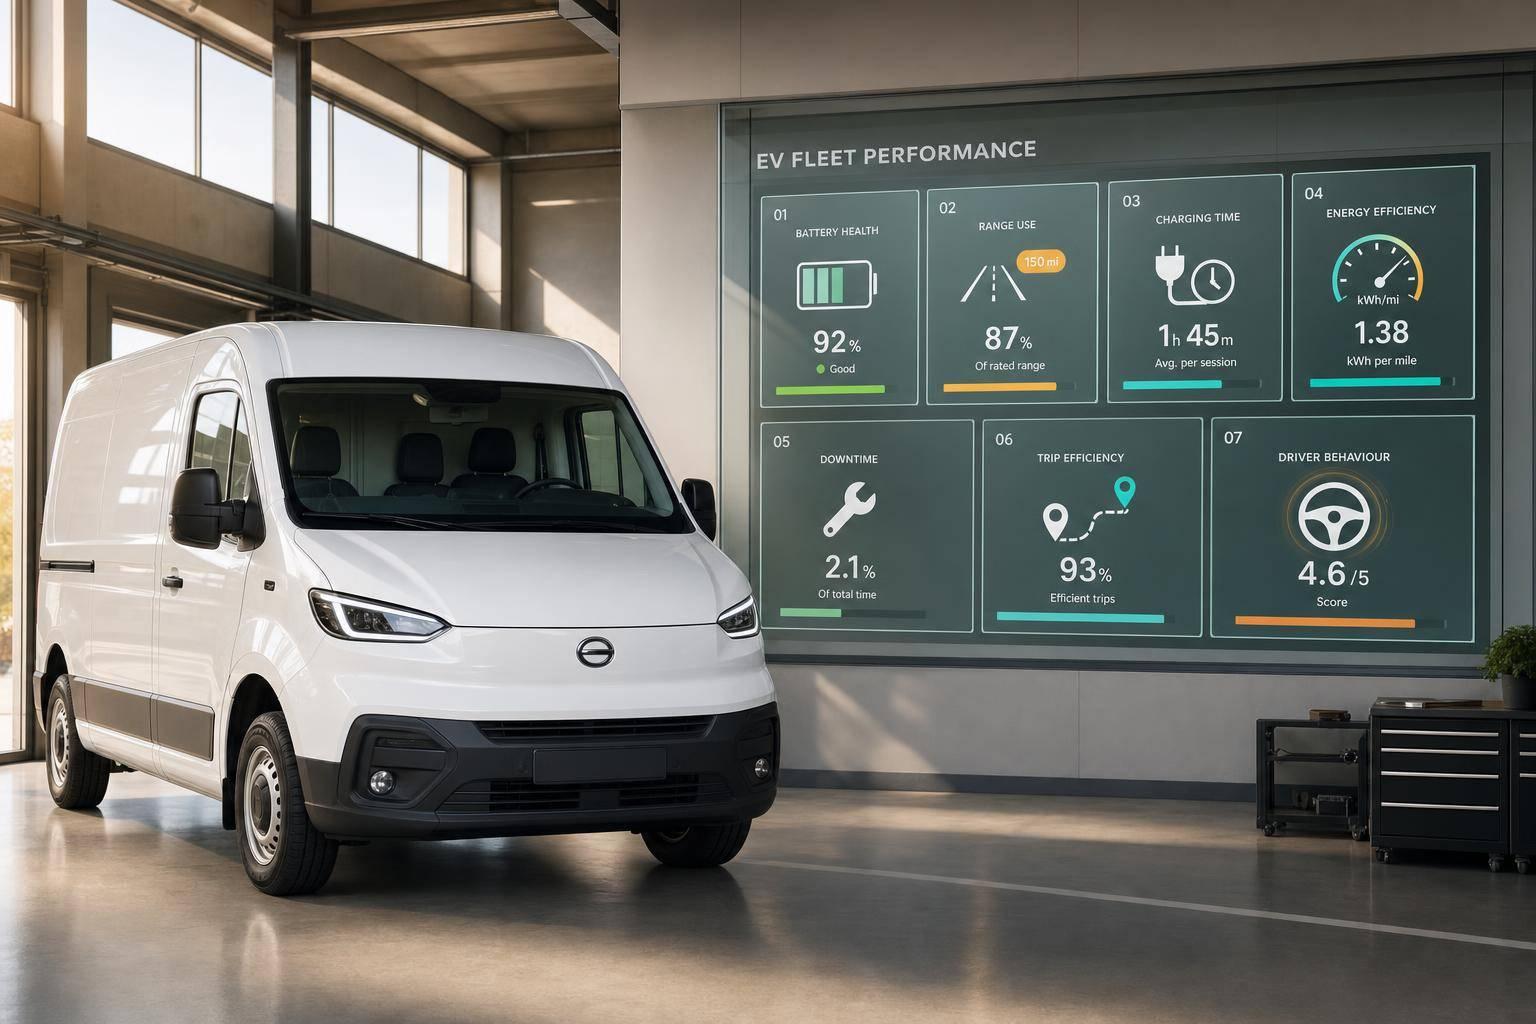
If I want a clear view of an EV fleet, I track seven numbers: battery health, range use, charging time, energy per mile, downtime, trip efficiency, and driver behaviour. These KPIs show which vans are ready, which routes fit the battery, where power is being wasted, and where delays start.
In plain terms, this article says:
- Battery health shows how much battery capacity is left
- Range use shows whether routes are too short, too long, or about right
- Charging time shows how long vehicles are tied up at chargers
- Energy per mile shows which vehicles, routes, or drivers use more power
- Downtime shows how often vehicles are off the road and why
- Trip efficiency shows how close each journey stays to plan
- Driver behaviour shows habits that push up power use and delays
A few of the main numbers stand out fast:
- Off-peak charging can cut electricity costs by 10–30%
- Cold weather or payload can cut usable range by 20–30%
- A good return charge target is often 15–25% SoC
- Many EV vans sit around 0.27 to 0.35 kWh per mile
- A vehicle off the road can cost about £800 a day
- Better route planning can cut distance by 10–20%
- Better driving can cut energy use by 10–20%
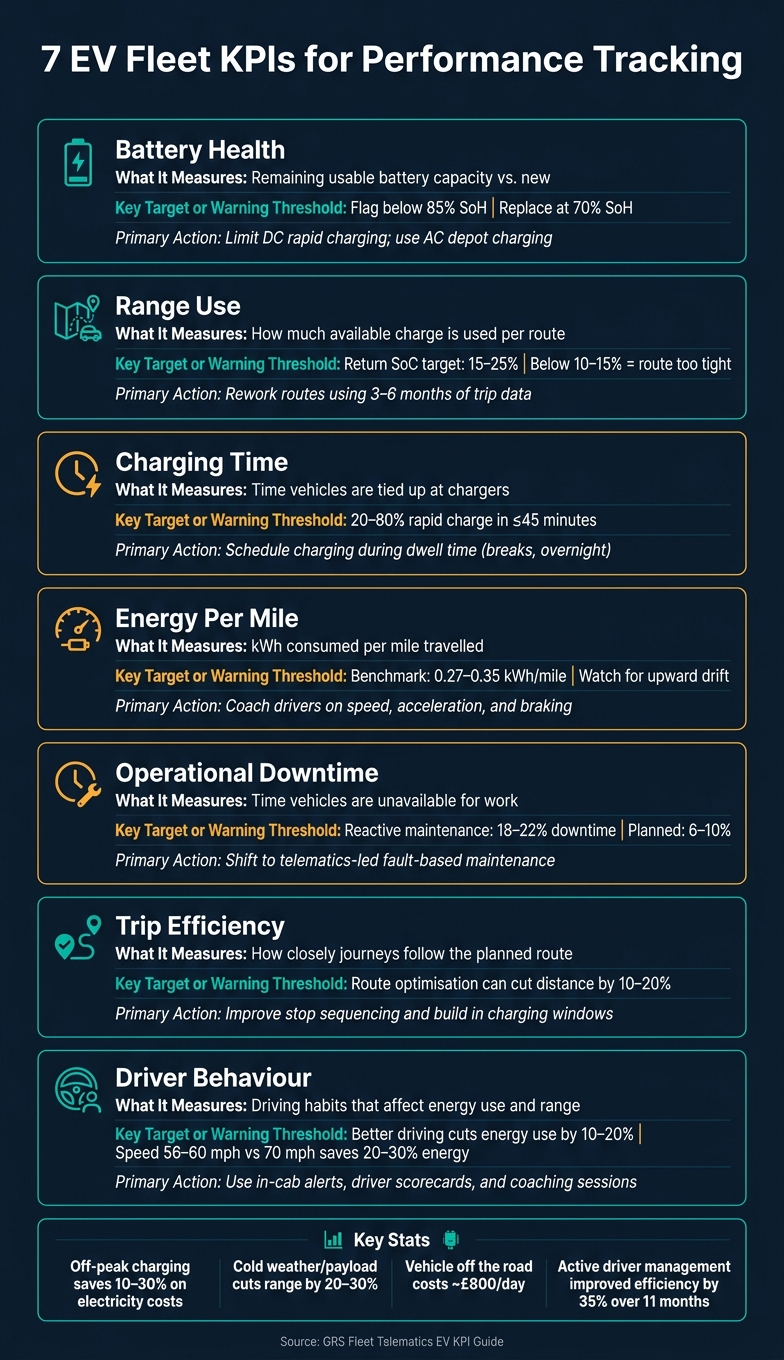
7 EV Fleet KPIs: Key Metrics & Targets at a Glance
Quick comparison
| KPI | What it tells me | Common target or warning sign | Main action |
|---|---|---|---|
| Battery health | Battery ageing | Review below 85% SoH | Limit heavy rapid charging |
| Range use | Route fit | Aim for 15–25% return SoC | Rework routes |
| Charging time | Vehicle availability | 20–80% rapid charge in up to 45 mins | Charge in dwell time |
| Energy per mile | Power use per mile | Watch for drift above normal route levels | Check driving, tyres, payload |
| Downtime | Time off the road | Track planned vs unplanned loss | Use fault-based maintenance |
| Trip efficiency | How well trips follow plan | Flag repeat overruns and detours | Improve stop order and timing |
| Driver behaviour | Driving habits that affect range | Watch harsh events and speed | Use alerts and coaching |
So the short version is simple: when I track these seven KPIs together in one telematics view, I can cut wasted charge, cut lost vehicle time, and make route planning more reliable.
Why EV fleet KPI tracking matters
Without clear metrics, EV fleet decisions turn into guesswork. And that usually shows up first in cost control.
Electricity spend is harder to follow than diesel because it doesn’t happen at one till or one forecourt. It’s spread across depots, public chargers and different tariff periods. By tracking energy per mile (kWh per mile) for each vehicle and route, fleet managers can see where power is being lost through driving style, routing or auxiliary load. Off-peak charging can cut costs by 10–30% compared with daytime rates.
The same data can also flag whether energy use is putting extra strain on the battery. Battery metrics help protect asset value by showing whether charging habits are reducing battery life.
Downtime and delivery reliability are tightly linked. A van that needs unplanned charging halfway through a route can throw off the whole day’s schedule. Tracking operational downtime by cause - charging delays, maintenance or faults - helps managers sort avoidable problems from unavoidable ones. For time-sensitive work like courier rounds or field service, that difference has a direct effect on whether promised delivery windows are met.
Driver behaviour also shapes energy use, so KPI tracking helps show where coaching can cut consumption.
First: battery health.
1. Battery health
State of Health (SoH) is the main battery metric. It shows how much usable capacity is left compared with when the pack was new, shown as a percentage. So if a van has 88% SoH, it has lost 12% of its original usable capacity. Over time, that loss adds up, and each vehicle can do less in a normal working day.
The main issue isn't only whether the battery is in good shape. It's what that means for route coverage.
When SoH drops, daily range drops with it. That often leads to more charging stops. For UK fleets working to tight urban schedules, even a 10–15% fall in battery capacity can mean one fewer job per van per day or a route that now needs a mid-shift charge. And that's where the pain starts to show. A van that used to finish its round with room to spare may suddenly need extra planning, extra charging, or both.
Vehicles with weak battery health are also more likely to miss route completion or be pulled from service for diagnostic checks. That reduces the number of vans ready to work. As SoH falls, fleets may need extra vehicles to carry the same workload, or they may need to charge more often, which cuts into productive driving hours. Frequent DC rapid charging speeds up battery degradation and shortens service life.
Telematics data source
Fleet telematics platforms pull battery metrics straight from the vehicle's Battery Management System (BMS). Track:
- SoH
- current charge level
- battery temperature
- charging history
That gives you a clear view of how each battery is ageing.
Improvement action
Set a clear SoH threshold. Flag any vehicle that drops below 85% SoH for review, and treat 70% as the practical end of its useful service life. Where operations allow, keep daily charging within a 20–80% SoC window and lean more on slower AC depot charging instead of roadside rapid chargers.
Platforms like GRS Fleet Telematics can automate alerts for critical low SoC events or excessive rapid charging frequency, so managers can spot patterns early and act before they turn into reliability problems.
Battery health sets the limit; the next KPI shows how far vehicles actually get from that limit in day-to-day use.
2. Range use
If battery health sets the limit, range use shows how much of that battery the fleet actually uses day to day.
In simple terms, range use tracks how much of a vehicle’s available charge gets used on a route or shift. That helps you see whether a route is realistic and whether the vehicle is carrying more battery capacity than the job needs.
Operational impact
The return SoC tells you a lot, fast. If vans come back with too much charge left, the route is under-used. If they roll in nearly empty, the route is too long. A return SoC of 40–50% usually means the route is too short. Anything below 10–15% means the route is too tight. That’s one of the clearest signs of whether route planning matches how EVs work in practice.
For UK multi-drop fleets, this matters a lot. Quoted range can look fine on paper, but actual range can be 20–30% lower in cold weather or when the van is carrying weight. So the benchmark should be actual range, not brochure range: under 70% is safe, 70–90% needs a confirmed starting charge, and above 90% needs either a planned charging stop or a different vehicle.
Poor range use cuts both ways. On one side, you pay for battery capacity you’re not using. On the other, you get unscheduled charging stops, delays and missed jobs. Neither outcome is cheap. A return SoC of around 15–25% is often a better target because it helps fleets cover the same workload with fewer vehicles. In some cases, it also opens the door to combining routes or putting off extra vehicle purchases.
Telematics data source
Telematics platforms measure range use by combining several data points:
- SoC readings over time
- GPS trip data
- Odometer readings
- Speed profiles
- Ambient temperature estimates
From that, the system can work out things like miles per 10% SoC, residual SoC at the end of a route, and the gap between planned and actual route distance. That shifts range use from a rough guess to a practical route-fit metric.
Improvement action
Review 3–6 months of trip data to spot routes that keep over-using or under-using available range. If certain routes keep bringing vehicles back with high residual SoC, rework them and bundle jobs so the charge is used more efficiently.
Set a clear target band, such as an end-of-shift SoC of 15–25%, and flag any route that keeps falling outside that band for monthly review. GRS Fleet Telematics can generate exception reports when vehicles or routes miss their range-use targets, which makes it easier for managers to catch patterns before they turn into bigger operational problems.
3. Charging time
Charging time has a direct effect on vehicle availability. Every minute a van spends at a charger is a minute it can't be used. Battery health tells you how much capacity is left. Charging time tells you how fast that capacity can be put back in for the next shift.
Operational impact
A 50 kW DC rapid charger will usually take a van from 20% to 80% SoC in 30–45 minutes. If sessions are taking much longer, that's worth a closer look.
The impact is pretty simple: longer sessions slow depot throughput and can push vehicles beyond their planned charging windows.
One of the best ways to cut this drag is to schedule charging during normal dwell time. That means overnight parking, driver breaks, or loading windows, so the van is charging while it would be standing still anyway.
Telematics data source
Track:
- start and end times
- charger type and power rating
- location
- start and end SoC
- kWh delivered
- whether the vehicle was actively charging or just plugged in
That last point matters more than it might seem. Plugged-in time without actual charging can make sessions look longer than they were. It can also point to charger faults or driver mistakes.
GRS Fleet Telematics can pull together live location, vehicle status, and event logs to show exactly when vans are at a charger, how long they've been there, and whether that lines up with planned charge windows. That makes it much easier to check if sessions fit the plan, not just how long they lasted.
Cost or utilisation effect
Longer charging sessions increase labour costs, push fleets towards higher-cost public charging, and leave fewer vehicles ready for work.
Improvement action
Set a clear target for each charger type. For a rapid 20–80% charge, aim for no more than 45 minutes and flag any overruns.
It also helps to charge to 80% instead of 100%. The last stretch is slow, and that taper phase can leave vans sitting at chargepoints for only a small range increase.
GRS Fleet Telematics can send alerts when a vehicle hasn't started charging when it should, or when a session runs past its expected length. That gives managers time to step in before a charging delay turns into an availability issue.
Once charging time is under control, the next step is to look at how far each unit of energy takes the fleet.
4. Energy per mile
Energy per mile - usually tracked as kWh per mile - shows how much electricity a vehicle uses for each mile travelled. Lower numbers mean the vehicle is using energy more efficiently. It gives you a simple like-for-like way to compare vehicles over the same distance, even across similar routes.
On mixed routes, average EV use is often put at about 0.27 to 0.35 kWh per mile. If one vehicle keeps landing above that range, it’s worth checking the basics: driving style, tyre pressure, payload, and mechanical condition.
Operational impact
This metric tells you, in plain terms, whether a route, driver, or vehicle is using more energy than it should.
When kWh per mile starts to climb, usable range drops straight away. If a van’s consumption moves from 1.5 to 2.0 kWh/mile, it will travel fewer miles on the same charge. That can mean rerouting jobs, shifting schedules, or swapping vehicles at short notice. It can also point to under-inflated tyres, dragging brakes, or wheel misalignment.
In many cases, you’ll spot these shifts before they turn into broader availability issues.
Telematics data source
Van tracking solutions work out kWh per mile by combining GPS-derived trip distance with energy data from the vehicle’s CAN bus. That data can come through as direct kWh use per trip, or as SoC changes converted into kWh using the battery’s known capacity. From there, telematics can map energy use by route and by driver, and flag sharp jumps linked to traffic, hills, or driver behaviour.
Cost or utilisation effect
Energy per mile feeds straight into cost per mile. At £0.22 per kWh, moving from 1.8 to 2.2 kWh/mile pushes electricity cost from about £0.40 to £0.48 per mile - roughly £2,000 per year for a van covering 25,000 miles.
Improvement action
Telematics-led coaching can bring kWh per mile down by tightening up acceleration, braking, and speed control. Speed matters a lot here. Data often shows that energy use climbs sharply at higher motorway speeds, so sensible van speed policies can cut waste without hurting service levels.
Poor efficiency can also lead to avoidable downtime, which the next KPI covers.
5. Operational downtime
Operational downtime is the share of time a vehicle is unavailable because of maintenance, repairs, charging problems, accidents or compliance holds. When that happens, fleet capacity drops and utilisation takes a hit. It helps to track planned and unplanned downtime separately, so you can see which losses were expected and which ones could have been avoided.
For fleet managers, the main problem is speed: how fast does that lost vehicle time turn into missed jobs, reshuffled routes and pressure on the rest of the fleet?
Operational impact
When an EV goes out of service without warning, the effect shows up straight away. Routes get jammed up, shifts stretch out and service levels start to slip. In EV fleets, charging faults and battery issues can sideline vehicles or delay departures, which is a big problem for same-day delivery rounds or contracted response time SLAs.
High unplanned downtime can also force fleets to keep more spare vehicles than they actually need. That ties up capital and drags down overall utilisation.
Telematics data source
Telematics can help pinpoint why a vehicle is down by pulling in real-time diagnostics and fault codes from the vehicle. That includes battery irregularities, cell voltage imbalances and temperature spikes.
Cost or utilisation effect
The cost can add up fast. In a UK fleet setting, a vehicle off the road can cost around £800 per day in lost revenue, overtime and missed commitments. Fleets that rely on reactive maintenance often see 18–22% downtime, while telematics-backed planned maintenance can cut that to 6–10%.
Improvement action
The clearest way to cut downtime is to shift from reactive repairs to planned maintenance. In practice, that means setting maintenance schedules using telematics data, such as odometer readings, vehicle hours and live diagnostics, instead of relying only on fixed calendar intervals.
For EVs, close monitoring of battery health and motor performance matters even more. Sudden subsystem failures are harder to spot early without real-time data. Once downtime causes are logged in a consistent way, patterns start to stand out, and that gives fleet teams something concrete to act on.
That makes trip efficiency the next measure to watch.
6. Trip efficiency
Trip efficiency shows how closely a journey follows the plan: the route, timing, stops and energy use. It sits in the middle of range use and downtime. A vehicle can hit its range target and still lose time and energy if the trip itself is poorly run.
Operational impact
In EV fleets, small trip issues can snowball. When journeys keep drifting away from the plan, fleets often see missed delivery windows, fewer jobs finished per shift, and schedules that start to wobble. On top of that, inefficient trips use more energy. That makes range planning less dependable, which then spills into charger planning and shift scheduling.
Telematics data source
Telematics shows fleet managers what happened on the road, not just what was meant to happen. You can track GPS route history, planned versus actual distance, stop and dwell time, route deviations, and arrival and departure times. For EVs, energy use per trip and departure and arrival SoC help show whether a route consumed more energy than expected.
Cost or utilisation effect
Poor trip efficiency pushes up the cost per completed job. The vehicle spends more time travelling, waiting or taking detours without doing more work in return. Route optimisation can cut kilometres driven by 10–20% and energy use by 10–15%, largely by reducing detours, cutting idle time and improving stop sequencing.
Improvement action
The biggest wins usually come from better route planning and tighter scheduling. Group jobs by area, sequence stops to avoid backtracking, and build charging windows into the plan that fit how the fleet actually runs.
It also helps to plan around real battery state of charge and cautious range assumptions, not just manufacturer figures. That matters even more on routes with hills, mixed traffic or heavy payloads. Regular trip reviews matter too. Look at exceptions, not just averages. That’s often where the pattern shows up first: repeat congestion points, poor stop order, or routes that overrun again and again.
Driver behaviour shows whether the planned route is being driven efficiently.
7. Driver behaviour
Trip efficiency tells you what happened on a route. Driver behaviour tells you why it happened.
The same EV on the same route can burn through very different amounts of energy depending on the person behind the wheel. Hard acceleration pulls more current, builds extra heat and adds wear. And speed matters more than many fleets expect. Driving at 70 mph on a motorway instead of holding a steadier 56–60 mph can lift energy use by 20–30%, which cuts real-world range and can lead to unplanned charging stops.
Operational impact
Poor driving pushes energy use up, shortens real-world range and can force charging in the middle of a shift. Late braking also means less energy recovery through regenerative braking and more use of the friction brakes.
Telematics data source
Telematics gives you a clear view of what drivers are doing on the road. It can track harsh acceleration, braking, cornering, speeding and drive-mode use through GPS, accelerometer and CAN data.
GRS Fleet Telematics combines vehicle tracking with detailed driver-event reporting, helping operators spot which drivers set off alerts again and again, and which routes see those events most often.
Cost or utilisation effect
Efficient EV driving can cut energy use by 10–20%. Smoother driving can also lower tyre, brake and minor damage costs.
Improvement action
Start with in-cab alerts so drivers can correct issues in the moment. Then support that with regular driver scorecards and short coaching sessions built around trip playback.
When you track these behaviour patterns together, you can see which KPI is likely to shift first.
Using the 7 KPIs together to make fleet decisions
Read the KPIs as a set, not in isolation. Battery health shapes range, range changes charging needs, charging affects availability, and driver behaviour can push energy use up or down. When all of that sits in one dashboard, the pattern is much easier to spot and act on.
Track these metrics across three cadences.
| Cadence | What to watch | Decision |
|---|---|---|
| Daily | State of charge, charging completion, battery warnings | Dispatch readiness and same-day reallocation |
| Weekly | Energy per mile, range use, trip efficiency, driver behaviour scores, charger utilisation | Route efficiency, driver coaching priorities |
| Monthly | Battery SoH trends, downtime by cause, cost per mile | Fleet size, charger investment, vehicle replacement planning |
The next step is to turn those patterns into live alerts, exception reports and planned maintenance.
Daily alerts work best when they focus on exceptions. For example, a van that hasn't reached the minimum charge by its scheduled departure time, or a driver logging repeated harsh braking events in one shift. It's usually better to group these into one daily summary instead of firing off separate notifications all day. That cuts alert fatigue and helps supervisors focus on what needs action.
Weekly reviews are where the links between metrics start to stand out. A rising energy-per-mile trend might point to harsher driving, heavier congestion, or ageing batteries. Check driver behaviour, trip efficiency and SoH together to pin down the cause.
Monthly reporting turns those findings into planning. It gives you a clear business case built around £ per mile, £ per job and lost hours, which helps support decisions on route design, charger investment and when to move older EVs onto lighter-duty cycles, a common strategy in van tracking for rental and leasing companies.
How telematics supports EV fleet KPI tracking
Those KPI links only matter if all the data lands in one place. Telematics brings live SoC, trip data, charging activity and driver data into a single dashboard.
Live vehicle tracking is where it starts. Dispatchers can see each van’s current location, remaining range and charge status on one map. That makes it easier to assign jobs to vehicles with enough charge, avoid mid-shift charging problems, and move vans around fast when plans change. Charging logs also show whether vehicles are using depot charging windows or public rapid chargers.
Driver scoring links straight to energy per mile and trip efficiency. Telematics platforms score each driver on harsh acceleration, braking, cornering, speeding and idling. Put driver scores next to energy-per-mile trends and you can spot where coaching is likely to cut consumption. Exception alerts then finish the job. Instead of waiting for a weekly review, managers get told straight away when a vehicle hasn’t reached its minimum charge before a scheduled departure, or when a driver records repeated harsh braking events in one shift. That makes the KPI set much easier to run as one system, not seven separate reports.
GRS Fleet Telematics shows how these KPI data points can sit in one live view.
| Telematics capability | KPIs it supports |
|---|---|
| Live SoC and location tracking | Range use, operational downtime |
| Charging session logging | Charging time, range use |
| Driver scoring and alerts | Driver behaviour, trip efficiency |
| Battery health monitoring | Battery health, operational downtime |
| Exception and fault alerts | All seven KPIs through threshold-based alerts and reports |
Weekly and monthly reports then show actual trends, not estimates. Once the data is joined up, the next step is deciding which KPI needs attention first.
Conclusion
These KPIs show whether an EV fleet is efficient, available and under control on cost. The clearest picture comes from tracking all seven together: battery health, range use, charging time, energy per mile, operational downtime, trip efficiency and driver behaviour. Looking at just one number won't tell you enough.
Driver behaviour is a good example. Data from UK EV fleet deployments shows that active driver management improved average efficiency from 2.75 miles/kWh to 3.72 miles/kWh over 11 months - a 35% improvement in efficiency.
Telematics pulls all seven data points into one live view, so teams can spot issues and act straight away. Track the seven KPIs in one system, deal with exceptions fast, and fleet performance is much easier to keep on track.
FAQs
Which EV fleet KPI should I prioritise first?
Prioritise battery health first, with a close eye on State of Charge (SoC) and State of Health (SoH).
SoC tells you whether a vehicle has enough charge to finish its route. SoH helps you spot battery wear early, before it turns into a bigger issue.
Used together, these two metrics help keep day-to-day operations steady and make maintenance planning a lot easier. They also give you a strong starting point for improving charging, cutting wasted energy and getting more from the whole fleet.
What is a good return charge level for EV vans?
A good return charge level for EV vans is usually 20% to 80%. Keeping the battery in that range can help protect battery health and help the fleet last longer.
Used this way, EV van batteries can retain about 90% of their capacity after 1,000 charge cycles.
How often should I review EV fleet KPIs?
Use telematics with real-time data, alerts and automated reports instead of leaning only on fixed review schedules.
Check long-term metrics like State of Health (SoH) each month. But keep an eye on KPIs such as battery performance, charging status and driver behaviour as they happen. That way, you can spot problems early and make informed maintenance and day-to-day operating decisions before small issues turn into bigger ones.