
Data Guide for Fleet Charging Performance
Measure fleet charging by vehicle readiness: collect vehicle, charger, site and route data, track KPIs and act on same‑night alerts.
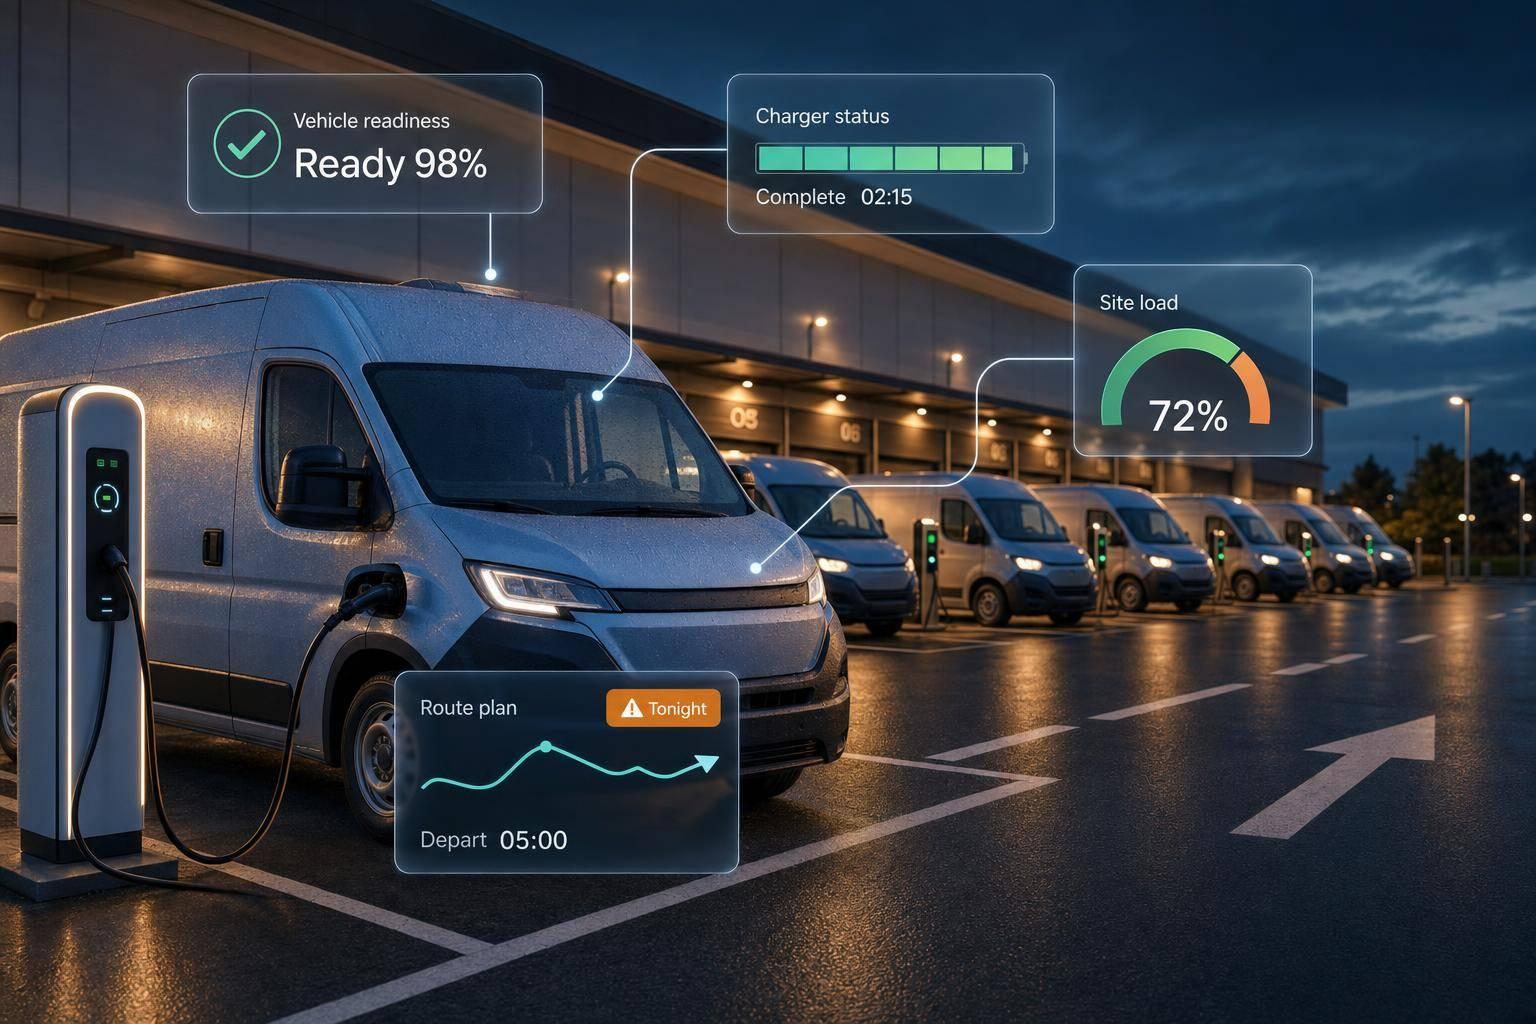
A depot can show high charger use and still send out vehicles that are not ready by 06:00. That is the main point: I should judge charging by vehicle readiness before departure, not by how busy chargers look.
Here’s the short version:
- I need data from four sources: van tracking solutions for vehicles, chargers, site load, and route plans.
- I should track a small KPI set: readiness rate, session success, charger availability, energy throughput, plug-in compliance, faults, and slow charging.
- I need a dashboard that shows what can leave now, what is at risk, and why.
- I should watch for depot patterns such as late plug-in, queueing, idle bay blocking, and load-limit slowdowns.
- I need alerts for same-night issues, such as:
- vehicles not plugged in by 21:00
- chargers offline for more than 10 minutes
- site demand above 90% of import capacity
- forecast SoC below target before departure
- Cost matters too: shifting charging into off-peak hours, often 21:00–06:00, can cut per-kWh costs by 35–55%.
This guide is not about making reports look busy. It is about using plain data to decide whether to reassign a vehicle, fix a charger, change bay use, or move charging into lower-cost hours.
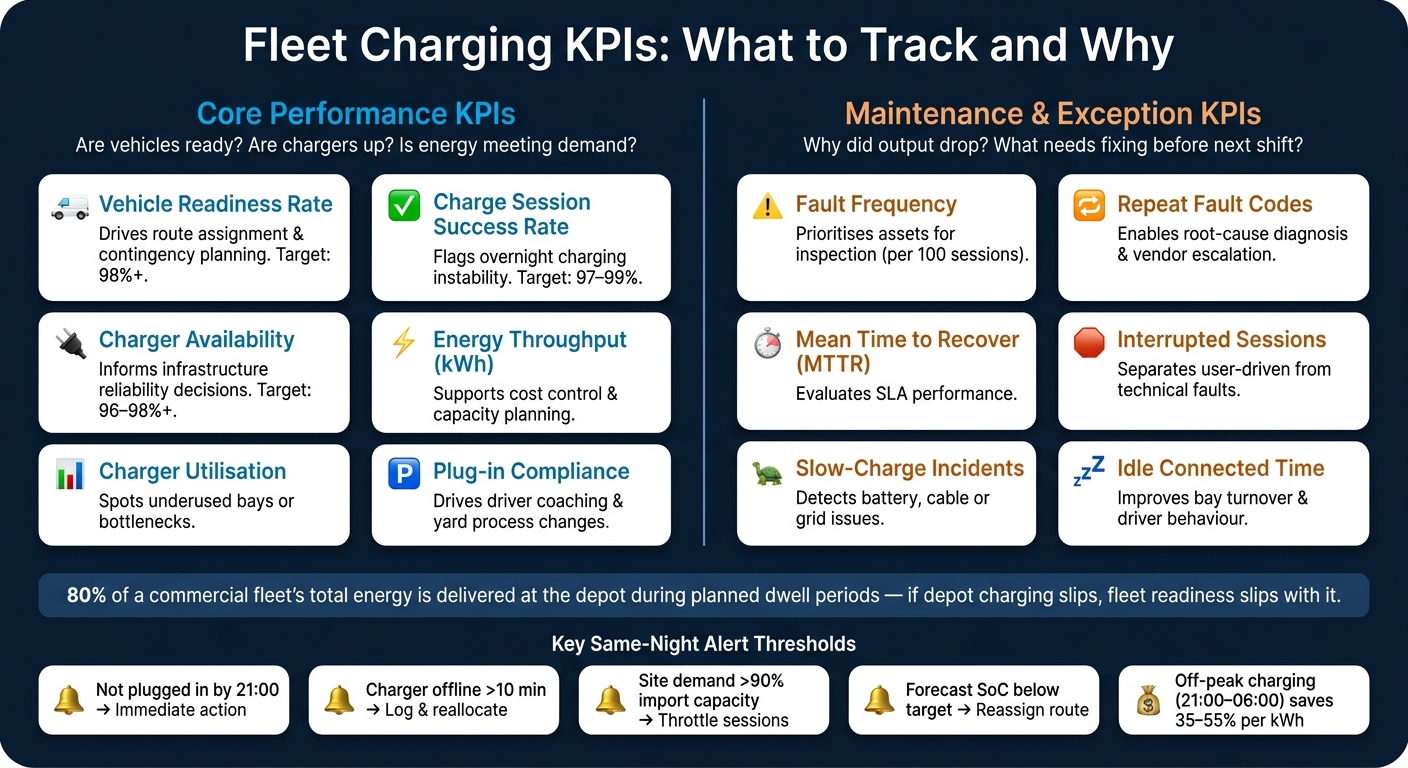
Fleet Charging KPIs: Core Performance vs Maintenance & Exception Metrics
EV Fleet Dashboard in Power BI

sbb-itb-499a7f0
1. Collect the right charging data from vehicles, chargers, depots and energy supply
You need four data streams: vehicles, chargers, site load, and route context. Each one fills a different gap in readiness reporting. Together, they give you the base for the dashboard and KPI layer that comes next.
Vehicle and charging session data
Capture one record per charging session with:
- vehicle ID
- charger ID
- arrival and departure time
- arrival and target SoC
- energy delivered
- charge power
- any fault codes
Arrival and departure SoC show whether a vehicle actually hit its readiness target. That sounds simple, but it matters more than it first appears.
Battery temperature also matters. In UK winter conditions, cold-soaked packs can charge more slowly and cut usable range. So a session may look complete on paper, yet the vehicle can still be short if temperatures fell overnight. Log session interruptions and error codes from the vehicle's battery management system (BMS) or the charger too. Those issues are often the first clue that a hardware fault is starting to show up.
| Data Field | Why It Matters |
|---|---|
| Arrival and departure SoC (%) | Shows whether the vehicle reached its readiness target |
| Charge start and end time | Reveals delays in plug-in and session length |
| Energy delivered (kWh) | Confirms whether the charger performed to specification |
| Max and average charge power (kW) | Flags underperforming sessions and charger derating |
| Session interruptions and error codes | Early indicator of charger or BMS faults |
| Battery temperature (where available) | Explains slow charging in cold or hot conditions |
Charger, depot and site load data
Charger-side data shows whether the infrastructure is doing its job. Focus on charger online or offline status, fault codes, connector availability, rated versus actual kW output, and kWh delivered per session.
If a charger keeps delivering well below its rated output, that's a red flag. Without charger-side data, it can look like a vehicle problem when it isn't.
At depot level, the key measure is the site import limit: the maximum power allowed by the DNO. You need interval load data, ideally at 5–15 minute granularity, to see how close the depot gets to that ceiling during evening and overnight charging windows.
When load gets close to the limit, chargers derate and sessions slow down. By morning, that can leave vehicles short of target SoC. Track those load-management cutbacks closely. They're often the missing piece when a depot asks, "Why were three vans undercharged last night?" That extra context turns raw session data into a proper readiness view.
Telematics and route data that gives charging context
Charging data on its own can't tell you if a session was enough. Mileage, schedule, and dwell time decide whether the recorded charge can support the planned duty cycle. In plain terms, route schedules and planned mileage turn a raw SoC number into a readiness verdict.
Telematics systems such as GRS Fleet Telematics can link charging performance to day-to-day fleet use. Overlay vehicle tracking data with charging records and you can see when a van entered the depot, where it parked, whether it went to the right charging bay, and how long it stayed still before departure.
That kind of visibility helps spot vehicles parked in non-charging bays instead of charging bays. Then the fix may be a depot layout change or clearer driver instructions, not guesswork.
Historic route and movement data also improves energy estimates by vehicle type, payload and season.
The next step is turning these feeds into live dashboards for dispatch and depot teams.
2. Build a dashboard around vehicle readiness, live status and trends
A good charging dashboard helps depot teams work out, in seconds, what can leave now, what cannot, and why.
Real-time dashboard panels for dispatch teams
Group live panels by function: vehicle status, charger status, site capacity and dispatch risk. That makes it much easier for a dispatcher to scan for exceptions instead of digging through logs.
The vehicle status panel should show each vehicle as ready, charging, plugged in, not charging, or fault or delay. That plugged in, not charging state matters more than it might seem. It is a common issue, and without a clear label, it is easy to miss.
The charger panel should flag any unit that is charging, faulted, offline, or available. The site capacity panel should show live load against the depot's import limit, plus queued vehicles. Seen together, that data helps teams tell the difference between a short-term load spike and a deeper site problem.
The dispatch risk panel should show depots likely to miss the morning run based on current SoC and departure times. That gives teams something they can act on straight away. Raw energy totals do not do that.
Once live status is on screen, the trend layer helps answer a different question: are the same issues coming back again and again? Use the historical view to spot recurring problems, not just one-off incidents.
| Panel Category | Real-Time View | Historical / Trend View |
|---|---|---|
| Vehicle Readiness | Current SoC %, ready to depart status, vehicles below target charge | Daily and weekly readiness rates, charging by time of day |
| Charger Status | Active sessions (kW), offline chargers, fault codes | Charger uptime %, repeated fault logs, downtime trends |
| Site Capacity | Live load vs. import limit, queued vehicles | Energy throughput by depot, charging activity by time of day |
| Dispatch Risk | Depots at risk of missing morning window, estimated time-to-ready | Recurring late-completion patterns, peak congestion windows |
Trend views for depots, vehicles and charging windows
Track daily and weekly readiness rates, energy throughput by depot and charger downtime to show whether performance is getting better or worse.
Time-of-day charging charts are especially useful. If charging starts too late in the night and the morning run begins before vehicles hit their target SoC, vehicles can still come up short with no clear alert. Plot charging activity by hour and those gaps tend to stand out straight away.
Cross-site comparison is where trend reporting starts to pay off for planning. If one depot keeps showing a lower readiness rate than others using the same vehicle types, that points to a deeper issue. It could be undersized supply, poor bay allocation, or a charger that fails at the same time each day. In other words, not a one-off incident.
Compare depots using the same KPIs over the same time window. If underperformance keeps showing up, the depot layout, power limit or charger allocation needs a closer look.
These live and trend views feed the KPI layer in the next section.
3. Track the KPIs that show whether charging is working
Use the live dashboard views from the previous section to watch a small set of KPIs each day. Keep the list tight. The aim is simple: track the numbers that affect dispatch decisions.
Core KPIs for charging performance
Focus on a short KPI set that tells you three things: are vehicles ready, are chargers up, and is delivered energy meeting demand?
Vehicle readiness rate shows the percentage of vehicles that hit their required state of charge before their scheduled departure. Charge session success rate shows how often sessions finish without a fault or interruption. Charger availability shows the share of planned operating hours when each charger is online and ready to use. Energy throughput shows whether delivered kWh lines up with route demand.
Charger utilisation shows how much of the available time a bay is charging. But don’t read it on its own. A busy charger means little if vehicles still leave short of charge. Plug-in compliance tracks the share of vehicles physically connected by a set cut-off time. This catches a very different issue: not charger failure, but drivers not plugging in at all.
Telematics can add a useful layer here. It can show when a vehicle entered the depot geofence and whether it reached a charger bay before cut-off. Put those two signals together and managers can spot vehicles that were on site but still not connected by cut-off. That makes it easier to tie non-compliance to specific drivers or yard processes.
Maintenance and exception KPIs
Core KPIs tell you what happened. Maintenance KPIs help explain why output dropped.
Fault frequency, measured per 100 sessions or per day and split by charger and fault type, turns raw counts into something you can compare across assets. Repeat fault codes show the same issue coming back on the same unit within a set time window, which helps with root-cause work and vendor escalation.
Mean time to recover (MTTR) shows how long it takes to return a faulted charger to service. Interrupted sessions, where charging ends before the target SoC, should be grouped by cause. Driver unplugging, power fluctuations, site load-shedding and software timeouts all point to different fixes.
Slow-charge incidents matter too. If a charger delivers far less power than expected, a vehicle may leave with less usable range before the morning run. Idle connected time, the gap between charge completion and unplugging, is another one to watch. It wastes bay capacity and cuts overnight throughput.
| KPI | Type | Primary audience | Action it drives |
|---|---|---|---|
| Vehicle readiness rate | Core performance | Dispatch & operations | Route assignment and contingency planning |
| Charge session success rate | Core performance | Operations & energy manager | Investigating overnight charging stability |
| Charger availability | Core performance | Depot manager & engineering | Infrastructure reliability decisions |
| Energy throughput (kWh) | Core performance | Finance & energy manager | Cost control and capacity planning |
| Charger utilisation | Core performance | Depot manager | Spotting underused bays or bottlenecks |
| Plug-in compliance | Core performance | Operations & driver leads | Driver coaching and yard process changes |
| Fault frequency | Maintenance & exception | Maintenance & engineering | Prioritising assets for inspection |
| Repeat fault codes | Maintenance & exception | Maintenance & OEM support | Root-cause diagnosis and vendor escalation |
| Mean time to recover (MTTR) | Maintenance & exception | Maintenance & management | Evaluating SLA performance |
| Interrupted sessions | Maintenance & exception | Operations & maintenance | Separating user-driven from technical faults |
| Slow-charge incidents | Maintenance & exception | Engineering & OEM support | Detecting battery, cable or grid issues |
| Idle connected time | Maintenance & exception | Depot manager & operations | Improving bay turnover and driver behaviour |
How to set targets that match fleet duty cycles
Set targets from departure time, route length, charging window length and site power. Don’t set one benchmark for the whole fleet and assume it fits every site. It won’t.
A first-wave parcel or home-delivery depot with a 06:30 departure faces a very different job from a service van fleet with more flexible 07:30 starts and variable daily mileage. In the first case, a vehicle readiness rate of 98% or above is a sensible starting point, along with a clear contingency plan for any shortfall.
Overnight AC charging sessions should target a session success rate of 97–99%, because when these fail there’s often no easy recovery window before the morning shift. DC fast chargers used for same-day recovery charging should aim for charger availability of 98% or above. AC overnight chargers may be able to live with 96–97%, provided faults are fixed before the next charging window opens.
Build targets from your own duty cycle data, including:
- first-wave departure times
- overnight charging window length
- typical route mileage
- depot power capacity
Those inputs will give you a readiness target and a session success threshold that match what the fleet actually needs.
4. Read depot charging patterns and turn exceptions into actions
KPIs tell you if charging went to plan. Depot patterns tell you why it didn’t. That’s the bit that helps you fix problems before they hit the next shift.
Look at the whole depot, not just one charging session at a time. When you compare actual charging with planned duty cycles, weak spots start to stand out fast.
Patterns that reveal undercharging, queueing and wasted dwell time
Around 80% of a commercial fleet's total energy can be delivered at the depot during planned dwell periods. So if depot charging slips, fleet readiness usually slips with it.
Focus on a few signals that tell the real story: plug-in delay, overnight timing, bay occupancy after charging ends, and morning SoC against target. For example, if vehicles keep arriving and then sit for 30–60 minutes before being plugged in, that usually points to a people or layout problem, not a charger fault. And if a vehicle stays plugged in for an hour or more after it’s full, that bay is being blocked for the next vehicle.
| Planned | Actual | Impact on operations |
|---|---|---|
| Vehicles arrive 18:00–19:00 and plug in within 15 minutes | Many arrivals before 18:00; 45–60 minute delay before plug-in | Early arrivals idle; late plug-in causes undercharging and morning gaps |
| Charge in the 20:00–06:00 off-peak window | Sessions frequently start after 23:30 and end close to departure | Higher £/kWh costs and minimal buffer for faults or slow charging |
| Target SoC 90% by 06:00 | 20% of vehicles at 60–75% SoC at 06:00 | Routes cut or swapped; more mid-route charging stops |
| Chargers freed within 30 minutes of charge completion | Vehicles stay plugged in for 2+ hours after charge completion | Queueing, longer driver wait times, reduced effective charger capacity |
It also helps to compare charger use with plug-in compliance. That’s how you tell a hardware shortfall from a depot process issue.
- If chargers are idle while vehicles are parked nearby and not connected, the issue is process.
- If every charger is in use and vehicles still leave undercharged, you probably need more capacity, more power, or better load management.
Exception alerts that need an immediate response
Some charging problems can wait for the end-of-day review. Others can’t. If the fix window closes before the morning shift, waiting is not an option.
Use same-day alerts for any miss that puts next-day readiness at risk.
| Alert type | Trigger | Correct response |
|---|---|---|
| Vehicle not plugged in by set time | Vehicle at depot not connected by 21:00 or 30 minutes after arrival | Contact driver or depot staff; move vehicle to charger; prioritise based on departure time |
| Session faulted or interrupted | Charging stops unexpectedly before target SoC | Diagnose fault; restart session; reassign vehicle if recovery time is insufficient |
| Charger offline | Charger unavailable for more than 10 minutes during planned window | Log maintenance ticket; reallocate vehicles to other chargers; update charging schedule |
| Unusually slow charging | A 50 kW charger delivers under 20 kW for 15–30 minutes without scheduled throttling | Check battery temperature and site load; inspect charger; consider moving to a different bay |
| Site load near import limit | Demand above 90% of agreed import capacity for more than 10 minutes | Throttle non-priority sessions; pause low-priority charging; reschedule to off-peak |
| Vehicle will miss target SoC | Forecast SoC below target at scheduled departure time | Reassign the route or vehicle; adjust departure time; prioritise high-power charging |
Geofence entry times, matched with charger connection data, make the “not plugged in” alert much more exact. GRS Fleet Telematics can supply those location and dwell-time signals.
Using reporting in the daily fleet planning routine
Make morning and end-of-day reviews part of the daily dispatch routine. This doesn’t need to be complicated. It just needs to happen every day.
In the morning - usually between 05:00 and 06:30 - the job is simple: check readiness. Which vehicles have reached target SoC? Which ones are still charging? Which ones have fallen short? Any vehicle marked “at risk” needs a quick call. Reassign the route to a ready vehicle, push the departure time back, or move it to a DC fast charger if one is free. It also makes sense to adjust departure order so the best-charged vehicles leave first.
In the evening, look at queue length, wait time, and undercharged departures. If the same routes keep coming back late and squeezing the overnight charging window, that’s a scheduling issue rather than a charging issue. In that case, the fix may be to add chargers, change the bay layout, or move some routes to en-route DC charging.
Conclusion: From charging reports to better fleet planning
Charging analytics only matters when it leads to action: which vehicles will be ready each morning, and what needs to change before the first departure?
Start there. Then track only the measures that point to readiness and cost. When you trend those KPIs week on week, it becomes much easier to see whether changes to depot schedules, charging windows or site setup are working.
If the numbers start to dip, depot patterns usually show where things are going wrong. Undercharging, queueing and wasted dwell time often point to problems with schedules, bays or power. Spotting those patterns in regular reports - and linking them to clear planning changes around bay allocation, charging windows and power limits - turns a charging dashboard from a screen you watch into a tool you use.
Those changes only stick when route data lines up with the depot plan. UK fleets need to judge charging against mixed vehicle types, time-of-use tariffs and route demands. Telematics location and dwell-time data, including GRS Fleet Telematics, adds the route context that makes charging reports useful in day-to-day planning.
The best charging report ends with a decision: reassign a vehicle, escalate a fault, shift a departure window or move charging into off-peak hours.
FAQs
Why isn’t charger utilisation enough?
Charger utilisation on its own tells only part of the story about fleet health and efficiency. It shows how often a charger is in use, but it doesn’t tell you the battery’s state of charge, how long vehicles sit plugged in, or whether grid capacity is holding things back.
That missing context matters. If fleets rely on charger use alone, they can end up scheduling charging badly, putting extra strain on batteries, and missing cheaper off-peak tariffs. A better picture also looks at energy-based utilisation, uptime, and whether vehicles are actually ready when they’re needed.
What data do I need first?
Start with the core telematics data:
- journey energy use in kWh per kilometre
- total daily mileage
- dwell times at depots and customer sites
- vehicle State of Charge and State of Health
Then look at your site’s energy profile too. Check peak power demand and your grid connection limit so you can see whether your setup can handle charging without adding avoidable costs.
How should I set charging alerts?
Focus on state-of-charge (SoC) thresholds and the day-to-day exceptions that can throw a fleet off track.
A good starting point is to set low-charge alerts at around 20% to 30%. That usually gives drivers enough range to finish their routes while still leaving a buffer in case something changes, like traffic, a detour, or an extra stop.
It also helps to turn on automated alerts for irregular charging activity. That includes things like failed charging sessions and vehicles entering or leaving designated charging zones. With real-time telematics handling this in the background, fleet teams can spot issues early and keep vehicles on the road instead of dealing with last-minute surprises.