
9 Fleet KPIs Live Telematics Software Tracks
Nine telematics KPIs to monitor: utilisation, idling, routes, fuel, driver behaviour, stops, unauthorised trips, downtime and recovery.
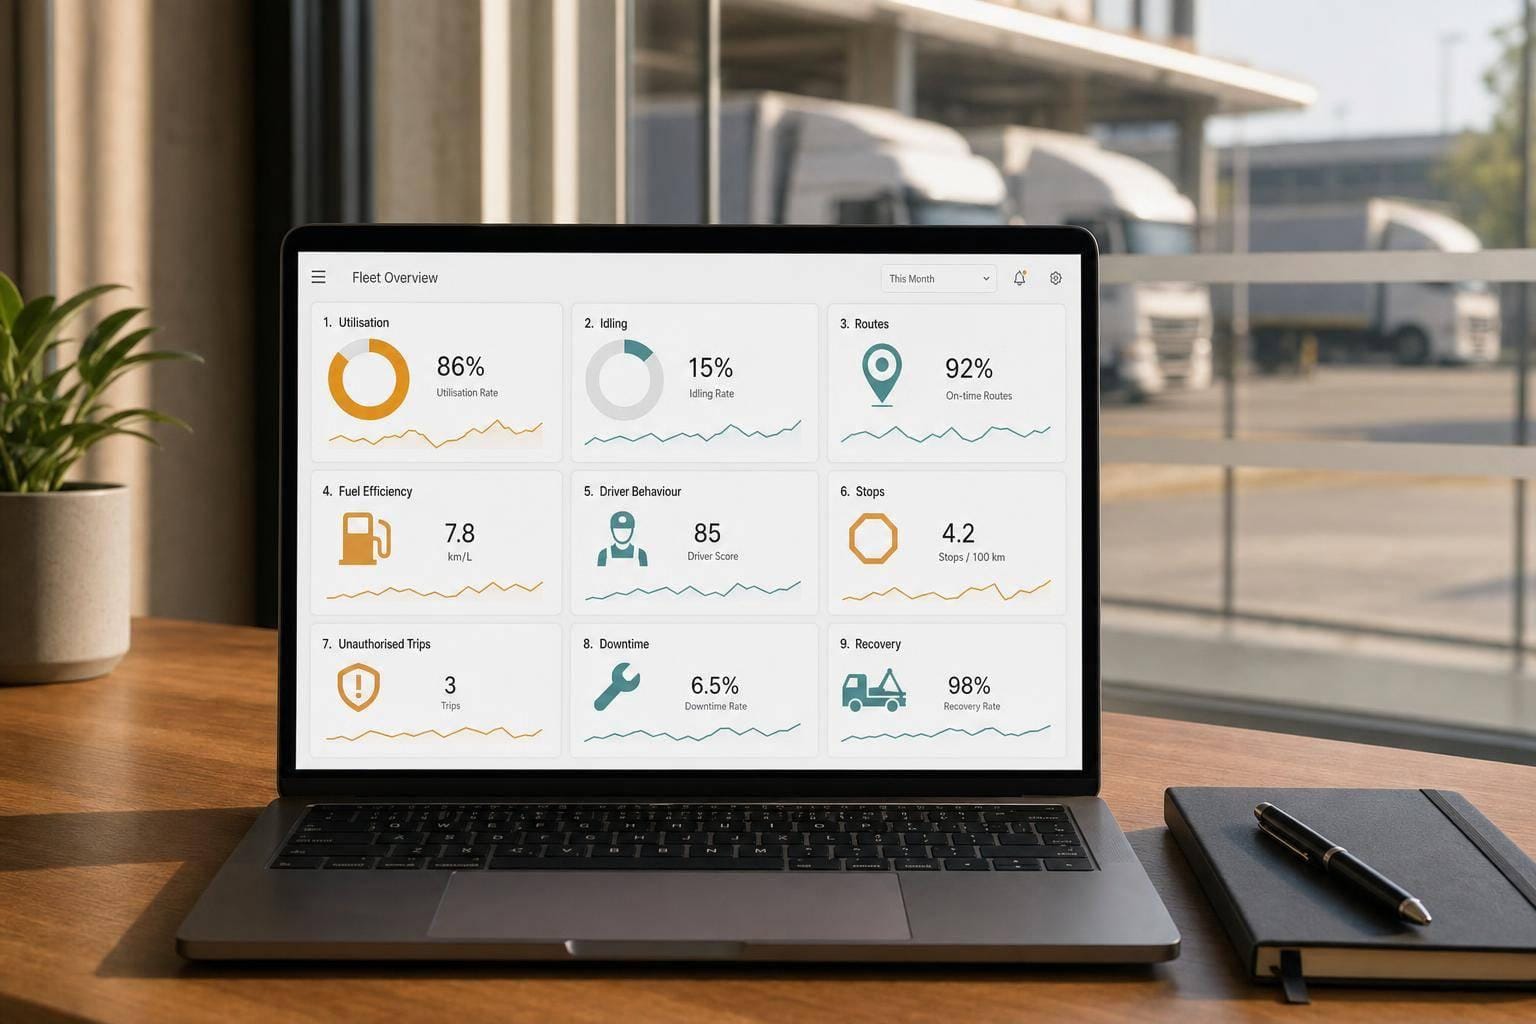
If I had to cut fleet tracking down to the KPIs that matter most, I’d watch these nine: vehicle use, idle time, route delays, fuel use, harsh driving, stop time, out-of-hours trips, downtime, and theft recovery. Together, they show where money leaks, where service slips, and where vehicles are at risk.
I’d use them like this:
- To trim waste: watch idle time, fuel per mile, and stop time
- To keep work on track: check vehicle use and route delays
- To cut risk: flag harsh driving, out-of-hours trips, downtime, and recovery status
A few numbers stand out. Idling can burn 1–2 litres per hour. Good route planning has cut 877,500 miles a year in one case. Many fleets aim for under 8% downtime. And with tracked theft recovery, vehicle recovery can reach about 95%, compared with under 28% without it.
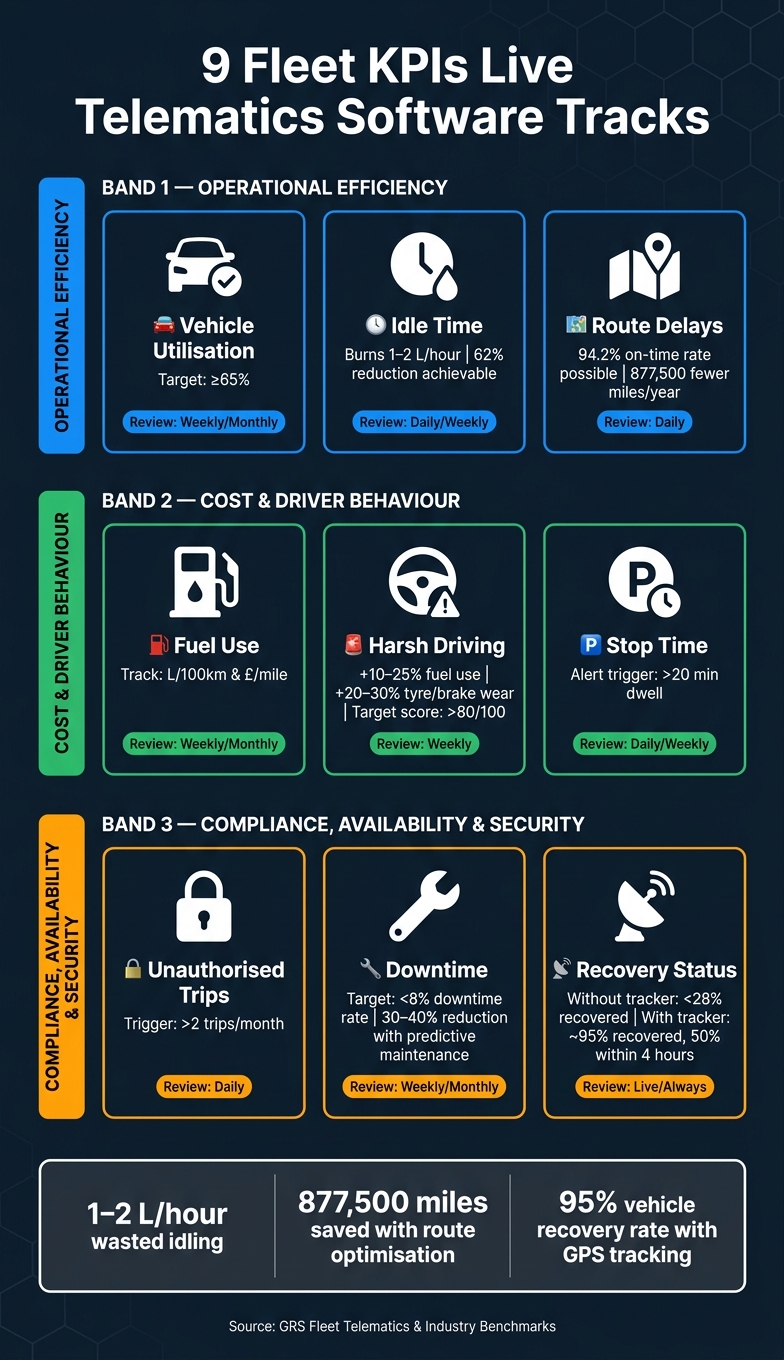
9 Fleet KPIs Every Telematics Dashboard Should Track
Tracking the company fleet KPIs with Dashboards
sbb-itb-499a7f0
Quick comparison
| KPI | What I’d check | Why it matters | When I’d review it |
|---|---|---|---|
| Vehicle use | Hours used vs hours available | Shows underused vehicles | Weekly or monthly |
| Idle time | Idle hours, idle % | Cuts fuel waste and dead time | Daily or weekly |
| Route delays | Delay minutes, on-time rate, extra miles | Shows where jobs slip | Daily for timed work |
| Fuel use | L/100 km, £/mile | Tracks running cost | Weekly or monthly |
| Harsh driving | Events per 1,000 km, driver score | Links to fuel, tyres, brakes, risk | Weekly |
| Stop time | Average dwell per stop, extra stops | Shows delays at sites and depots | Daily or weekly |
| Out-of-hours trips | After-hours movement, zone breaches | Flags misuse or rule breaks | Daily |
| Downtime | Downtime rate, fault trends | Helps keep vehicles on the road | Weekly or monthly |
| Recovery status | Recovery rate, time to recover | Measures theft response | Live / at all times |
I’d treat this list as a working checklist, not just a report. Set a target, link each KPI to an action, and act when the numbers move.
Operational efficiency KPIs
1. Vehicle utilisation
Start with utilisation. It tells you whether you have the right number of vehicles in the right places.
Vehicle utilisation measures how much of a vehicle’s available capacity is used for revenue-generating work. The formula is simple: operating hours ÷ available hours × 100. A van running 40 hours in a 168-hour week sits at 24%, which is below the 65% light-vehicle benchmark.
Live telematics can pull this from engine status, GPS movement and trip history. Put those data points together and you can compare utilisation by vehicle type, depot or time of day. That makes patterns easier to spot. For example, long-wheelbase vans may be busy all week while smaller vans sit idle at weekends.
When a vehicle keeps falling below your utilisation threshold, you’ve got a few practical choices:
- Redeploy it to a depot with stronger demand
- Consolidate routes that overlap
- Decide not to replace it when the lease ends
UK fleet experts recommend piloting redeployment for 8–12 weeks before making any permanent fleet-size decision.
2. Idle time
Idle time is engine-on time when the vehicle is stationary and not doing productive work. It’s usually tracked as idle hours, idle percentage and fuel wasted. For a typical diesel van, idling can burn around 1–2 litres per hour.
Hotspot reporting helps you see where the problem starts. Is it a customer site? A queue at the depot? Or just driver habit? That matters, because the fix changes depending on the cause. In a telematics-led anti-idling programme reported by Automotive Fleet, average idling dropped to 1.7 hours per vehicle per week - a 62% reduction - after targeted measures were introduced.
A five-minute stationary threshold works well here. Send an alert to the driver or manager as soon as that limit is hit. That shifts idle data from a passive report into something you can act on straight away, whether the issue is scheduling, site access or queue management.
3. Route delay and route performance
This KPI looks at the gap between the plan and what happened on the road. The main figures to track are delay minutes per stop, on-time arrival rate, planned versus actual mileage and recurring late stops.
GPS route playback helps dispatchers spot detours, backtracking and route segments where vehicles keep losing time. That gives you a clear basis for changes like resequencing routes, resetting customer time windows or moving jobs to a different vehicle. One route optimisation case study reported 94.2% on-time delivery and 877,500 fewer miles annually after routes were redesigned using this kind of data.
In UK logistics, best practice is to review these KPIs daily for time-critical delivery work and weekly for work with more flexible timing. Planned versus actual mileage should sit alongside punctuality. A route can arrive on time and still waste miles. Or it can look tight on mileage but keep running late.
These three KPIs show where efficiency slips before you get into cost and driver behaviour.
Cost and driver behaviour KPIs
These KPIs show where day-to-day running costs start to drift up.
4. Fuel use and fuel efficiency
Start with fuel. It’s one of the simplest costs to track, and one of the first places where waste shows up.
Focus on L/100 km and fuel cost per mile (£/mile). L/100 km shows how efficiently a vehicle uses fuel over distance. Fuel cost per mile adds the money side, which makes it easier to compare diesel, petrol and hybrid vehicles on the same basis.
Live telematics ties fuel data to actual trips by combining GPS trip data with fuel card transactions or onboard fuel data where that data is available. In plain terms, you can match fill-ups to specific vehicles and time windows, then spread fuel use across trips based on mileage and operating patterns.
That gives you a much clearer picture of which vehicles, drivers or routes are doing well, and which ones are using more fuel than they should. It can also flag off-route refuelling, which may point to fuel misuse.
5. Harsh driving
Harsh driving comes down to three trackable behaviours: sharp braking, rapid acceleration and aggressive cornering. Telematics devices log these as events using G-force thresholds. For instance, deceleration beyond -0.4 g can trigger a harsh braking event.
Raw totals only tell part of the story. That’s why fleets usually normalise them into harsh events per 1,000 km. This makes comparisons fairer when one driver covers far more distance than another.
Aggressive driving can increase fuel use by 10–25% and push brake and tyre wear up by 20–30%. That means more parts, more workshop time and more money going out the door.
Many fleets use a 0–100 driver safety score that blends speeding, harsh braking, rapid acceleration and cornering. A fleet average above 80/100 is often used as a sign of a well-run, low-risk driver group. UK guidance also points to a couple of low-risk markers:
- Fewer than 2 speeding incidents per 100 miles
- Under 1.5 harsh braking events per 100 miles
Scorecards help you spot which drivers need coaching. Just as important, they show whether that coaching is making a difference.
6. Stop time
Stop time tracks how long a vehicle stays still at a depot, delivery point or job site. Telematics measures dwell time from the moment movement stops to the moment the vehicle moves again.
The main KPIs here are average stop time per job, total stop time per route and scheduled versus unscheduled stops. Excessive dwell alerts can flag vehicles that stay at one location beyond a set limit - say, more than 20 minutes at a non-depot site - and give dispatchers a prompt to look into it.
That can uncover all sorts of issues. Maybe there’s a loading bay bottleneck. Maybe paperwork is holding things up. Maybe someone has taken an unauthorised break.
When stop time starts creeping up, cost per mile goes up with it, because the vehicle and driver are still costing money while standing still. Cut average dwell at customer sites by even a few minutes per stop, and the gain adds up across a full day’s schedule. It also has a direct effect on jobs completed per vehicle per day.
These KPIs lead into compliance, availability and security.
Compliance, availability and security KPIs
These KPIs shift the focus from cost to control: who’s using your vehicles, whether they’re ready when needed, and what happens if one disappears.
7. Unauthorised trips
Track after-hours movement, out-of-zone mileage, and geofence breaches. In practice, geofence breaches are one of the clearest ways to spot unauthorised movement. If a vehicle is used outside approved rules, it will usually show up as a zone violation, a distance anomaly, or an out-of-hours event.
The main figures to watch are:
- trip count outside working hours
- distance driven outside authorised zones
- geofence breach count per vehicle per month
To stop alerts becoming noise, use tiered notifications. Send serious breaches straight to a fleet or security lead, and group lower-risk anomalies into a daily or weekly digest. A sensible trigger point is any vehicle logging more than two unauthorised trips per month. Then check those alerts against rotas and job logs so you can tell the difference between a genuine emergency call-out and misuse.
These figures also help with duty-of-care duties under UK health and safety law. If a vehicle is used outside approved hours or areas, timestamped telematics logs show what happened and when. That gives you a clean record when you need to separate a valid call-out from misuse.
8. Downtime
Downtime falls into two buckets: planned and unplanned. The second one is the problem, because it hits service continuity.
Fleet Downtime Rate (%) = (Total downtime hours ÷ Total available operating hours) × 100
Many UK fleets aim to stay below 8% downtime. It also makes sense to track MTBF and MTTR, because they show how often vehicles fail and how long repairs take.
Live telematics can pick up DTCs early and flag faults before they turn into breakdowns. Say a van keeps showing a DPF-related code or a battery health warning. The system can trigger an inspection and let you reassign that vehicle before it fails mid-job. Telematics-enabled predictive maintenance can provide 7–14 days' advance warning of critical component issues and can cut unplanned downtime by 30–40% compared with reactive maintenance. UK fleets using telematics for maintenance management recorded a 30% drop in unplanned repairs in 2023.
Out-of-service statuses matter too. The moment a critical fault is detected, the vehicle is marked as unavailable. That stops dispatch from sending work to a vehicle that’s already off the road.
9. Recovery status
Theft hits fleet availability, revenue, and insurance costs all at once. The KPIs worth tracking here are theft incidents, recovery rate, 24-hour recovery rate, and average recovery time.
Without specialist tracking, fewer than 28% of stolen vehicles in the UK are ever recovered. Put a tracker and a stolen vehicle recovery (SVR) service in place, and that figure rises to around 95%, with 50% recovered within four hours and 80% within 24 hours.
GRS Fleet Telematics reports a 91% recovery rate. GRS Fleet Telematics' dual-tracker setup keeps vehicles visible if a device is tampered with.
To make this KPI useful day to day, log the time from theft report to tracker activation, time to location confirmation, and time to physical recovery. That shows where delays are happening and whether your current setup is doing its job. A high recovery rate paired with short recovery times can also help with insurance terms, since underwriters look closely at active risk management when pricing commercial fleet premiums. Recovery time deserves as much attention as recovery rate.
Conclusion: Build a fleet KPI checklist you can act on
Nine KPIs. Three control areas. That’s a simple way to turn a dashboard into something your team can use day to day.
Those nine KPIs sit across three action areas: efficiency, behaviour and security. Framed that way, the dashboard stops being a passive report and starts working like a management tool.
The next step is where most fleets either make progress or stall: attach a clear action to each KPI. If idle time goes up, cut idling. If route delay climbs, re-plan routes and update routing rules. If fuel use looks off, improve fuel efficiency. If drivers show harsh events, coach them. If dwell time grows, work on reducing it. If unauthorised trips appear, investigate them. If maintenance flags start stacking up, bring servicing forward. And if a theft alert is triggered, move fast on recovery steps by putting asset tracking and police coordination first.
Without a set response tied to each KPI, you’re not managing a fleet. You’re just collecting data.
Results improve when teams act on the data, not just collect them.
A simple checklist helps. Use three columns:
- Metric
- Target
- Action
Some metrics need constant attention. Recovery status, for example, should be watched all the time. Others, such as utilisation and idle time, are better suited to a weekly or monthly review. The point isn’t the review date. The point is acting on the trend when it starts to move.
Live telematics delivers when every alert leads to a decision. For theft recovery, GRS Fleet Telematics' dual-tracker technology and 91% recovery rate can support a faster response. For routing, fuel, driver behaviour and vehicle availability, the same rule applies: real-time data only improves outcomes when it leads to action.
FAQs
Which fleet KPI should I track first?
Start with three core areas: efficiency, delivery performance and driver safety.
For efficiency, track fuel use and idle time. For delivery performance, look at on-time delivery rates. And for driver safety, watch harsh braking, rapid acceleration and speeding.
These KPIs give you a baseline. From there, you can spot quick wins, cut downtime and improve return on investment.
How often should I review telematics KPIs?
Review high-impact KPIs every week. That gives you a clear view of trends as they start to form, whether that's route inefficiencies, driver-specific fuel use, or safety alerts that need a fast response.
Then take a monthly look at broader performance trends and general telematics data. This helps you keep your strategy lined up with long-term targets while you keep fine-tuning day-to-day operations.
How do I turn KPI alerts into action?
Set up instant alerts for the events you manage, like excessive idling, harsh driving, route delays or deviations, unauthorised trips, and downtime or delayed recovery.
Then make a habit of checking alerts every week and reviewing trends each month. Send alerts by email or SMS, cut down false alarms, and use the dashboard data to reach the right driver or vehicle manager fast so you can decide the next step without delay.