
Predictive Maintenance with Van Tracking: Guide
Use van tracking telematics to spot faults early, reduce downtime and cut repair costs with data-driven alerts and scheduling.

I’d put it simply: van tracking helps me spot faults before they turn into breakdowns. By watching mileage, engine hours, fault codes, battery voltage, temperature, fuel use, tyre and brake patterns, I can decide whether to watch, book, or pull a van from service.
Here’s the whole idea in one view:
- Reactive maintenance means fixing a van after it fails
- Preventive maintenance means servicing it on time or mileage
- Predictive maintenance means using live data to act before failure
That matters because unplanned downtime can cost £1,172 per van per day, emergency repairs can cost 3 to 5 times more than planned work, and one case study in the article showed a 44.4% drop in downtime plus a 20% cut in costs.
If I were setting this up, I’d focus on:
- Fault codes for early warning signs
- Mileage plus engine hours to track wear more accurately
- Battery voltage to catch no-start risks
- Coolant, oil and fuel trends to spot strain
- Driver behaviour like harsh braking, cornering and idling
- Clear alert rules based on low, medium and critical risk
- Workshop timing based on route use and van availability
- Security support too, because uptime means little if the van is stolen
A simple way to think about it is this: one odd reading may mean nothing, but a pattern usually means action. If fuel economy drops by 10% on the same route, coolant temperature keeps climbing, or a fault code comes back, I’d stop treating it as noise.
| Maintenance type | What triggers it | Cost pattern | Downtime |
|---|---|---|---|
| Reactive | Failure | Hard to predict, often high | High and unplanned |
| Preventive | Fixed date or mileage | Steady, but can include extra work | Planned |
| Predictive | Live data and trends | More controlled | Shorter and scheduled |
So the article’s message is plain: track the right signals, set clear alerts, and act early enough to avoid bigger repair bills and lost road time.
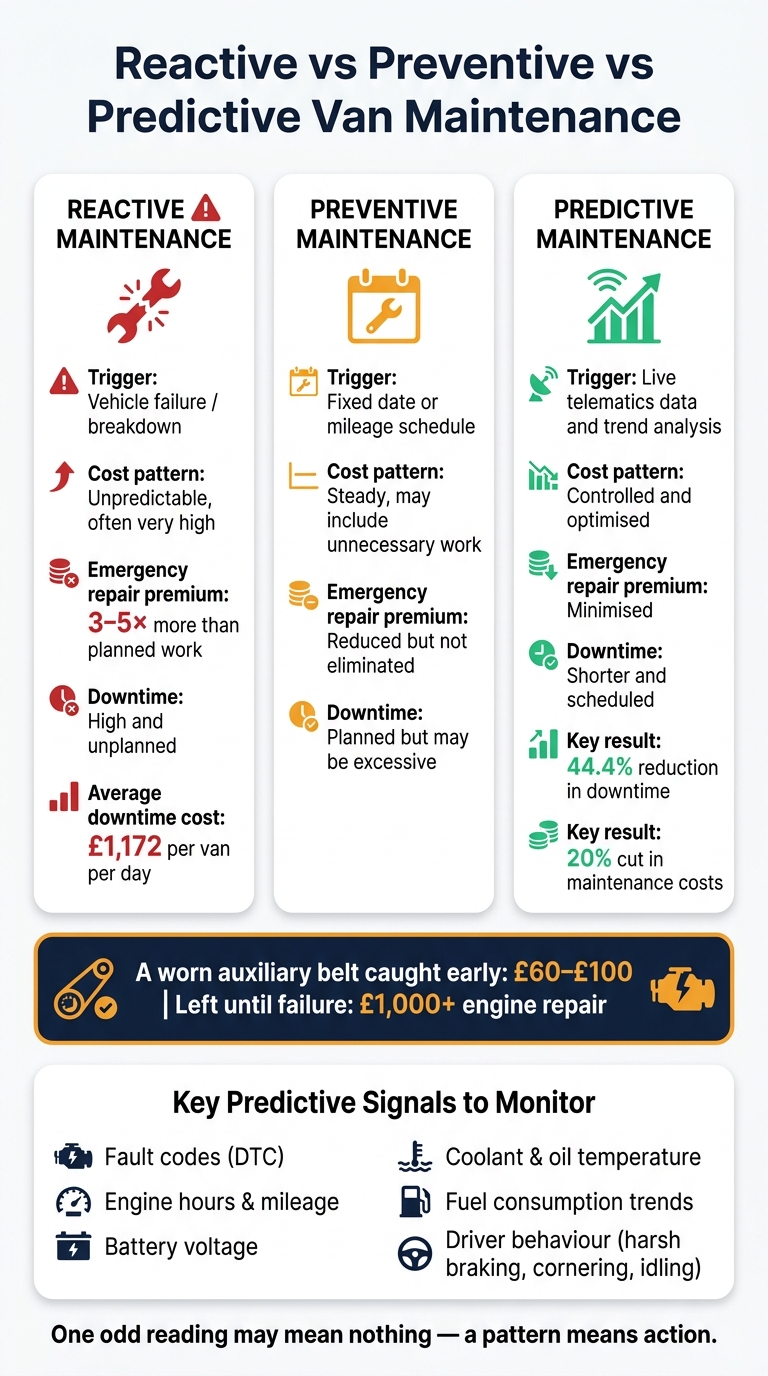
Reactive vs Preventive vs Predictive Van Maintenance: Cost & Downtime Comparison
The telematics data that matters most for van maintenance
Once your data feed is live, the next step is simple in theory and harder in practice: ignore the noise and watch the signals that point to failure.
You don't need every data point a van can produce. You need the ones that show wear building up, faults taking shape, or usage pushing parts harder than the service schedule suggests.
Engine, mileage and fault-code data
The clearest view of a van's condition comes from its own diagnostic systems. Diagnostic trouble codes (DTCs) are one of the main early warning signs, and they can stream into your telematics platform in real time. A repeat emissions code, a misfire flag, or a sensor fault may look small on its own. Leave it too long, though, and it can turn into a far more expensive repair.
Engine load and RPM show how hard the van is being worked. A stop-start city route puts more heat stress on the engine and turbocharger than steady motorway driving, even if both vans show similar mileage.
It also helps to look at odometer readings alongside engine hours. This matters even more for vans that spend long periods idling or doing short urban drops. Mileage on its own can give a false sense of comfort. A van with low mileage but high engine hours has still spent a lot of time running, and that extra stationary use wears the battery and engine parts without adding much to the odometer. Usage-based triggers such as engine hours and mileage track wear more accurately than annual servicing.
Fuel use can also tell you a lot. If MPG gets worse on the same route, that often points to injector, DPF or EGR trouble. Fuel-trim changes beyond about ±8% can also flag fuel-system issues before a fault code shows up.
Tyres, brakes, battery and driver behaviour indicators
Engine data shows mechanical strain. Tyre, brake, battery and driver behaviour data show how that strain is happening and whether wear is building faster than you'd expect.
Battery voltage patterns are easy to miss, but they can be a strong warning sign. A slow drop in resting voltage, deeper-than-normal dips during engine start, or uneven charging behaviour can point to battery or alternator trouble early on. Spotting that trend in time can help you avoid a no-start at the beginning of the working day.
Driver behaviour data links straight to wear rates. If one driver brakes hard again and again, brake pads and discs will wear faster than they would under smoother driving. Sharp cornering puts extra strain on tyre shoulders, suspension bushes and wheel bearings. Hard acceleration adds wear to the driveline and pushes up fuel use. You won't spot any of that from a fixed service calendar. You will see it in telematics data.
Here’s a practical map from raw data to workshop action:
| Data type | Likely affected component | Common warning pattern | Maintenance action |
|---|---|---|---|
| DTCs (fault codes) | Engine, emissions, transmission | Recurring codes; minor codes becoming frequent | Triage by severity; schedule diagnostic check |
| Engine load & RPM | Engine, turbo, drivetrain | Persistently high RPM on normal routes | Review duty cycle; inspect turbo, clutch and gearbox |
| Coolant temperature | Cooling system, head gasket | Average temp creeping up; repeated spikes | Check coolant, radiator and thermostat |
| Oil pressure & temperature | Lubrication system, bearings | Low pressure at idle; rising oil temperature | Replace oil and filters; inspect pump |
| Fuel consumption | Injectors, DPF, EGR | Worsening MPG on unchanged routes | Check air intake, injectors and aftertreatment |
| Odometer & engine hours | Overall wear profile | High hours with low mileage; high idle time | Adjust service triggers; coach on idling |
| Tyre pressure & temperature | Tyres, wheels, alignment | One corner consistently low or hot | Inspect for leaks; check alignment and loading |
| Brake wear & ABS events | Pads, discs, brake hydraulics | Rising ABS activations; rapid pad wear | Inspect pads and discs; check fluid and ABS components; coach drivers on braking habits |
| Battery voltage | Battery, alternator | Declining resting voltage; large start-up dips | Load-test battery; inspect alternator |
| Harsh braking & cornering | Brakes, tyres, suspension | Repeated high-G events; faster wear | Inspect components; targeted driver coaching |
The main gain comes from joining signals together, not jumping at one reading in isolation. One repeat fault code may not mean the van needs to go into the workshop straight away. But if that same code appears alongside worse fuel economy, higher coolant temperature and a pattern of harsh driving, the picture changes fast. That points to real component strain and a higher risk of failure. Combined signals help you see whether a fault is a one-off or part of a bigger pattern.
How GRS Fleet Telematics supports data collection
GRS Fleet Telematics provides van tracking hardware, dual-tracker technology and software from £7.99 per vehicle per month, helping fleets keep a steady data feed.
Those signals feed the alert thresholds covered next.
How alerts work and when fleets should act
Raw telematics data on its own doesn't tell you what to do. The platform takes live data, applies rules, and turns it into an alert with a severity level and a clear next step. It then sends that alert to a dashboard, email, or app. In most systems, live readings are checked against preset bands: normal, warning, and critical. If a value crosses one of those lines, or if a pattern starts moving the wrong way, the system creates an alert. After that, the key job is simple: decide when that alert is serious enough to justify workshop time.
Alert types, thresholds and severity levels
For predictive van maintenance, four alert types matter most: DTC-triggered alerts, sensor anomaly alerts, usage-based threshold alerts, and combined rule alerts. Combined rule alerts are especially handy because they flag issues when two or more signals point to the same fault at the same time. For example, that could mean high mileage since the last service, paired with high fuel use and repeated harsh-braking events.
Severity levels then turn those alert types into action priorities. Put bluntly, they help a fleet sort what can wait from what needs attention now.
| Alert severity | Example trigger | Recommended time-to-action | Likely workshop response |
|---|---|---|---|
| Low | Coolant temperature creeping up; single low tyre-pressure event that self-corrects | Review within 3–7 days; note for next service | Visual checks; defer work until scheduled service unless trend worsens |
| Medium | Battery voltage dips on cold starts; recurring non-critical DTC; tyre pressure consistently below recommended | Book a workshop slot within 24–72 hours | Targeted component inspection and replacement; ECU diagnostics |
| Critical | ABS or brake fault code; sustained overheating; oil pressure loss at operating temperature | Pull vehicle from service as soon as safely possible; same-day workshop check or recovery | Immediate safety inspection; component replacement; vehicle held until fault is rectified |
Using trends instead of one-off warnings
Treat drift as the trigger, not the single reading. One coolant temperature reading of 98°C on a single journey might not mean much. But if that same reading keeps showing up over a fortnight, and the van has climbed from a previous average of 88°C, that tells a different story. It points to a partially blocked radiator or a sticking thermostat that is getting worse.
The same idea applies to fuel economy. If a van's average drops by more than 10% over 30 days on the same route, that's worth checking. It's not just a blip to shrug off. Rate of change matters as much as absolute values. Dashboards that show rolling 30-day averages for key metrics, such as fuel consumption in mpg, coolant temperature, battery voltage, and brake events, make these patterns easier to spot before they turn into a roadside problem.
The practical gain here is timing. Say brake-pad wear is speeding up and harsh-braking events are also climbing. You can bring that van's brake inspection forward and tie it to its next booked service. That means one workshop visit instead of two. Less disruption, less time off the road.
Rules for booking vehicles into the workshop
Clear decision rules stop two common mistakes. The first is sending vans into the workshop for minor issues that can wait. The second is leaving risky faults untouched because the route plan is packed. A simple three-level framework works well.
Log and watch fits low-severity, one-off anomalies with no worsening pattern and no safety issue. Log the event, review trends each week, and plan a component inspection at the next service if more signs appear. No route changes are needed.
Book within 24–72 hours fits cases where anomalies repeat, a DTC comes back, or a clear deterioration trend shows up, but there is still no immediate safety risk. Put vans on high-mileage or time-critical routes near the front of the queue. Where possible, line the work up with an upcoming service so you don't lose the van for a second day. If technician time is tight, triage by severity: critical alerts get same-day attention, medium-severity issues take the open slots, and low-severity work is grouped with routine servicing.
Immediate pull from service fits any safety-related alert, such as ABS faults, severe overheating, serious tyre damage, sudden oil pressure loss, or combined indicators that suggest a failure is close. The driver should finish the current job only if it is safe to do so, then stop using the van. Parts supply matters here too. If the likely repair needs components with long lead times, acting early on a trend gives you time to pre-order parts and cut days from total downtime. That's where maintenance stops being just a repair task and starts becoming downtime control.
Using van tracking data to cut repair costs and downtime
Once alerts are live, the next job is simple: act on them early. That’s where lower repair bills and less downtime come from. The aim isn’t just to spot faults. It’s to deal with them before they turn into breakdowns, and to book work when the van is least likely to be missed.
Where savings come from in day-to-day fleet operations
Predictive maintenance helps cut emergency repairs, recovery fees, and lost income. Emergency repairs cost three to five times more than the same job handled as a planned visit. Then there’s the extra sting: roadside recovery, out-of-hours labour, and the revenue lost when a van can’t finish its jobs. Radius puts average unplanned downtime at £1,172 per van per day in the UK.
Acting on alerts early can also stop a small fault turning into a much bigger one. A worn auxiliary belt picked up at the warning stage might cost £60–£100 to replace. Leave it too long, and a snapped belt can cause overheating and lead to £1,000+ engine repairs. The same pattern shows up with brake discs, tyres, and cooling systems. Replace the worn part before it fails, and you protect the parts around it.
Driver behaviour data can trim costs too. Idling, harsh braking, and aggressive acceleration all add wear and use more fuel. It’s a bit like driving with one foot on the brake and the other on the throttle - money disappears faster than most fleets expect.
Planning maintenance around vehicle use and availability
Knowing when to bring a van in matters almost as much as knowing why. Trip history and utilisation reports show busy days, route patterns, and the natural gaps where workshop time causes the least disruption. When an alert reaches medium or critical severity, utilisation data helps you pick the best slot. That way, the van stays on the road for as long as it safely can, and the work still gets done before the fault gets worse.
The table below links the main cost pressures with the telematics signals that point to them, and the actions that can deal with them.
| Cost driver | Telematics signals | Action |
|---|---|---|
| Emergency repairs | Fault codes, temperature alerts, battery voltage | Prioritise critical alerts; plan rapid but scheduled workshop visits |
| Downtime and missed jobs | Utilisation reports, trip history, availability status | Stagger bookings; use spare vehicles; target off-peak slots |
| Fuel waste | Idling time, harsh events, speeding, route data | Driver coaching; anti-idle policies; route optimisation |
| Premature component wear | Harsh braking/acceleration, overloading indicators | Early inspection of high-risk vans; targeted coaching |
| Warranty and residual value risk | Odometer, service interval tracking | Maintain schedule compliance; keep records of timely servicing |
Fleets that book workshop time around actual vehicle use - not just fixed calendar dates - can keep vans earning while still stepping in early enough to avoid failures. One telematics case study found that after introducing condition-based maintenance, average monthly downtime per vehicle fell from 45 hours to 25 hours - a 44.4% reduction in downtime and 20% cut in costs.
Security, recovery and asset protection alongside maintenance
A stolen van can wipe out the savings from even the best maintenance plan. Predictive maintenance helps protect the mechanical condition of your vans, but that only pays off if the vehicle stays with you. If a van is stolen, the cost doesn’t stop at the vehicle itself. You also lose revenue, face hire costs, and may need to replace specialist tools or equipment.
GRS Fleet Telematics supports asset protection with dual-tracker technology. That helps protect the uptime gains made through maintenance.
Conclusion: building a predictive maintenance programme that works
Predictive maintenance works when data, alerts, thresholds and scheduling line up. It needs to run as one system with four connected parts, not as a one-off job. The value comes from turning those signals into a repeatable routine, not treating them as random warnings.
That approach is already showing clear results. Recent fleet results point to the upside: telematics-led servicing has delivered measurable savings and strong ROI when teams act on alerts on a consistent basis.
The next step is straightforward. Start with the core signals:
- mileage
- engine hours
- fault codes
- battery health
- temperature
- fluid levels
- key driver behaviour
Then set a standard response for every alert: who checks it, how soon they do it, and what happens after that. At the start, consistency matters more than fancy setup.
It also helps to review the numbers on a set schedule. Look at breakdowns, call-outs, workshop mix, downtime and repair spend each month or quarter, then adjust thresholds and coverage based on the pattern.
Maintenance only protects uptime if the van stays on the road and under your control. Pairing your maintenance programme with strong security, such as dual-tracker technology from GRS Fleet Telematics, helps protect the uptime gains you’ve worked for. Together, reliability and security keep vehicles moving and reduce avoidable disruption.
FAQs
How do I start predictive maintenance with van tracking?
Start by choosing the right hardware for your fleet, such as hard-wired trackers or OBD-II devices, to collect data on the engine, brakes and tyres. Then link those devices to your fleet management platform so all diagnostics sit in one place.
For a smooth rollout, test the system on 10 to 20% of your fleet for two to four weeks. During that trial, check that the data is accurate and set up a few basic alerts before you move on to advanced analytics.
Which telematics alerts need immediate action?
Red alerts call for immediate action. They point to serious issues like engine overheating, dangerous brake wear, cooling system pressure drops, active diagnostic trouble codes, and sudden mechanical failures that could affect safety or day-to-day use.
Moving fast can help stop a breakdown before it happens, cut the risk of costly emergency repairs, and keep vehicles in line with safety standards.
How often should I review maintenance data?
Telematics gives you continuous, real-time monitoring, which means you can stop relying on frequent manual checks. Instead of sticking to rigid, time-based schedules, you can review the data when the system sends an automated alert.
Those alerts show up as soon as readings move outside safe limits or the system spots a potential issue. That gives you the chance to step in early and, in some cases, deal with problems up to 60 days before a scheduled workshop visit.