How Route Metrics Cut Van Fleet Costs
Use route metrics—miles, idling, dwell and adherence—to cut fuel, overtime and maintenance, often saving 10–30% in fleet costs.
 By Michael Bar10 min read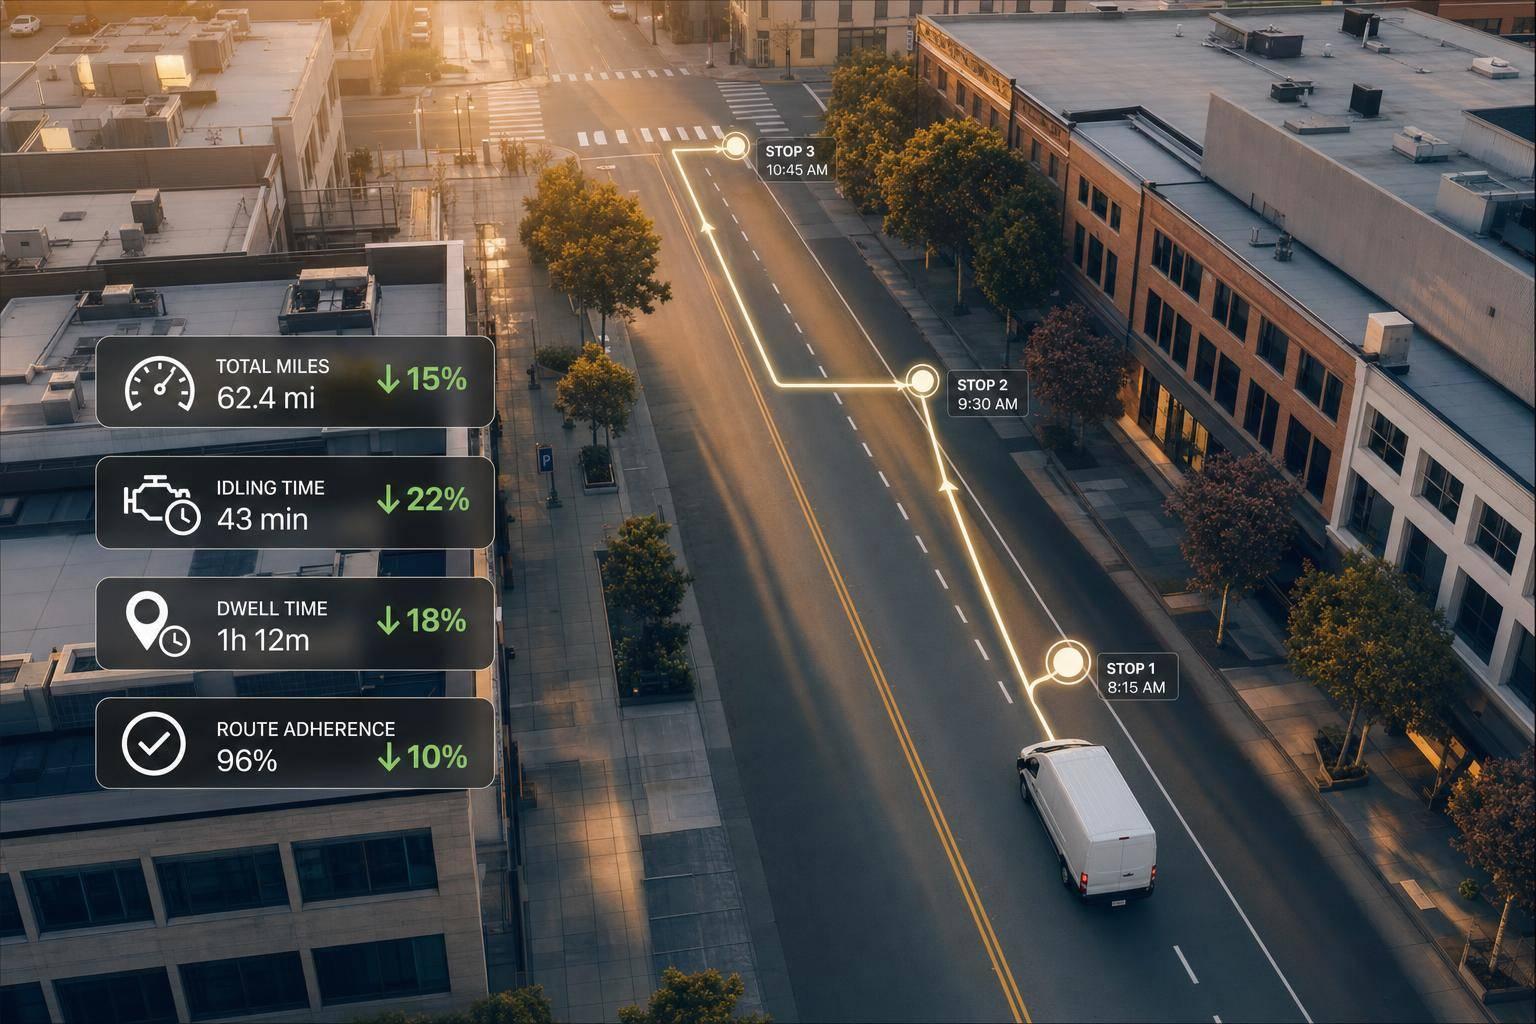
If I want to cut van fleet costs, I start with route data. The fastest wins usually come from fixing extra miles, idling, long stop times, and late arrivals. Even small route changes can trim fuel use, reduce overtime, and lower wear across the fleet.
Here’s the short version:
- I compare planned vs actual miles and planned vs actual time
- I track fuel per route, idle minutes, and dwell time at stops
- I look for detours, missed turns, and late drops
- I review the worst routes each week, then change stop order, timing, or driver guidance
- I use live tracking to deal with delays before they spread through the day
A few numbers show why this matters:
- Route optimisation can cut fuel use by around 12%
- Driver-behaviour monitoring can cut fuel costs by up to 20%
- Some vans idle for more than 100 minutes a day
- Idling can cost about £3 per hour, per van
- Poor route control can push maintenance costs 5–10% higher
- In some cases, route work backed by telematics cuts total fleet costs by 10–30%
What I take from this is simple: route metrics turn vague fleet costs into numbers I can act on. Instead of just seeing a high fuel bill, I can see which routes, stops, and habits are causing it - then fix them.
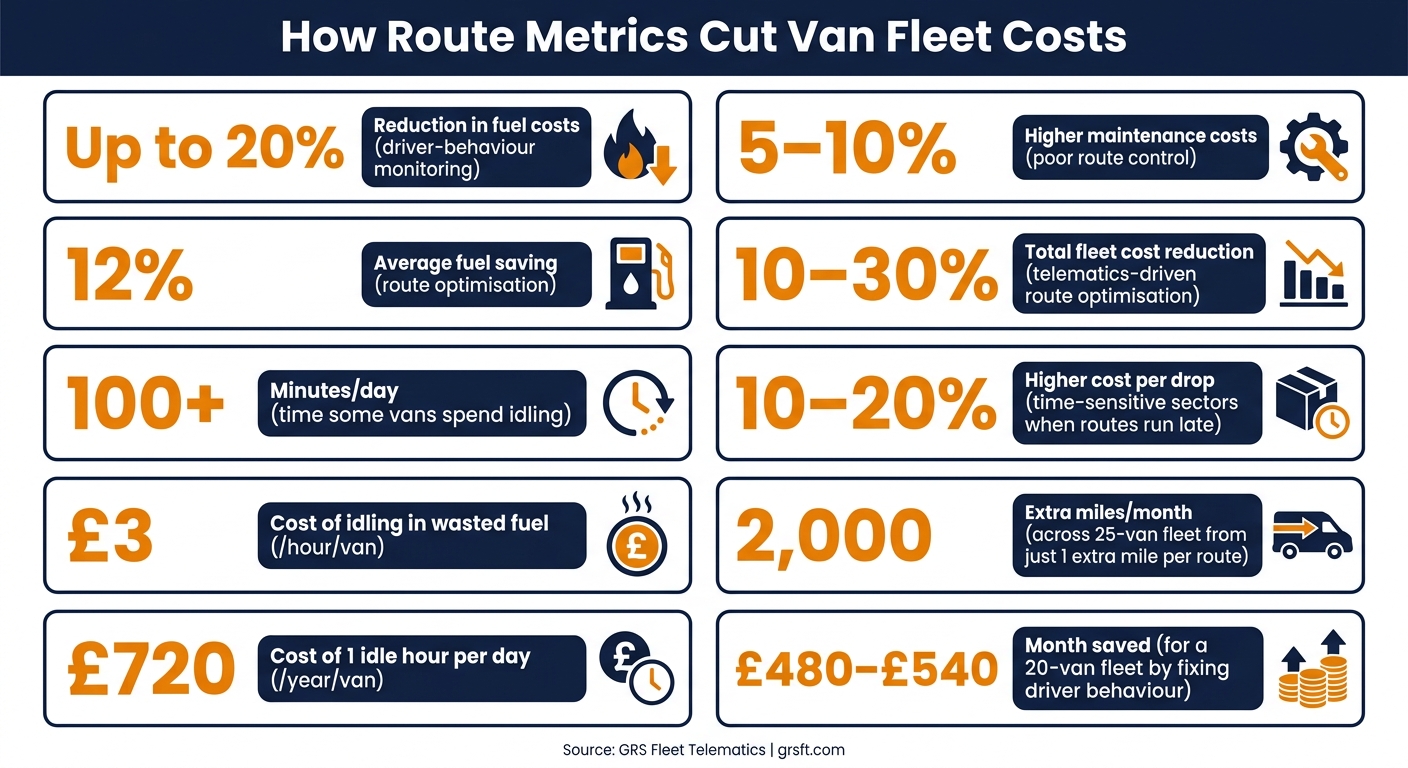
How Route Metrics Cut Van Fleet Costs: Key Numbers at a Glance
The route problems that push up daily running costs
Most fleet cost overruns come back to three route problems: extra mileage, too much stationary time, and late arrivals.
Excess mileage, poor stop order and detours
Route metrics make wasted distance hard to ignore. If stops are in the wrong order, a fleet route planner can prevent a route that should cover 80–90 km from ending up at 100–110 km instead. That adds 10–30 km in a single day. At 8–10 litres per 100 km, that works out at about 0.8–3 litres of extra diesel per van, per day.
And that’s just the start. Detours and missed turns add even more drag. Telematics data shows that some drivers make 10 or more deviations a week from their planned route. A single wrong turn might not sound like much, but if it adds 1–3 km and 5–10 minutes, those small losses stack up fast over a week.
The extra distance doesn’t just hit fuel spend. It also wears through tyres sooner, puts more strain on brakes, and brings forward unplanned maintenance. In fact, unmanaged mileage creep is linked to maintenance costs that are 5–10% higher per van than on well-managed routes.
Idle time and dwell time
Idle time means the engine is on while the vehicle is stationary. Dwell time is the full time spent at a stop. They’re not the same thing, but both eat into margin.
Idling on its own can cost about £3 an hour, per van in wasted fuel. One idle hour each working day comes to roughly £720 a year per van. That’s a quiet drain on the budget, and it adds up before anyone notices.
When idle and dwell time together take up 20–40% of the working day on poorly managed routes, the effect spreads well beyond fuel use. Fewer stops get done. Routes run over time. Then the operator has to make a call: pay overtime or send another van out to finish the work.
Late arrivals and service failures
Route inefficiency rarely stops at fuel and wages. Once a van falls behind at the first stop, the rest of the day often starts to unravel. That can happen because the route was overloaded, dwell time was estimated badly, or the stop order simply didn’t make sense.
When one stop runs late, every stop after it tends to slip as well. That pushes up failed-delivery costs, adds more dispatch time, and increases re-delivery spend. In time-sensitive sectors such as food, pharmaceuticals, and same-day business deliveries, cost per drop can climb by 10–20% even if fuel use changes only slightly.
Once teams can see these patterns in the data, they can compare planned routes with actual ones and strip out the waste on the next run.
How fleet teams use route metrics to improve planning and live execution
Compare planned routes with actual performance
Once you can spot the routes that keep causing trouble, the next step is simple: compare the plan with what happens on the road.
A good place to start is with a weekly planned-versus-actual review for each regular run. Track miles per drop, time per stop, total route duration, and route adherence - in plain terms, how closely drivers stuck to the planned route.
When those figures drift apart week after week, that usually points to a planning issue, not just a bad day. Say a multi-drop route is planned around a set mileage, but telematics data shows drivers keep travelling much farther to complete the same jobs. That’s a strong sign the stop sequence needs work. And when that extra mileage keeps showing up across the fleet, it hits fuel spend and stretches working hours.
Clear thresholds make this far easier to manage. A simple rule, such as flagging routes that keep missing mileage or time targets, gives teams a set review rhythm instead of relying on ad hoc fixes.
Use live tracking to cut delays on the day
Better planning helps on paper. Live tracking helps when the day starts to go off course.
With live tracking, dispatchers can see where each van is and how the route is progressing. That makes it easier to reroute around traffic, road closures, or other disruption before one delay turns into a string of missed stops.
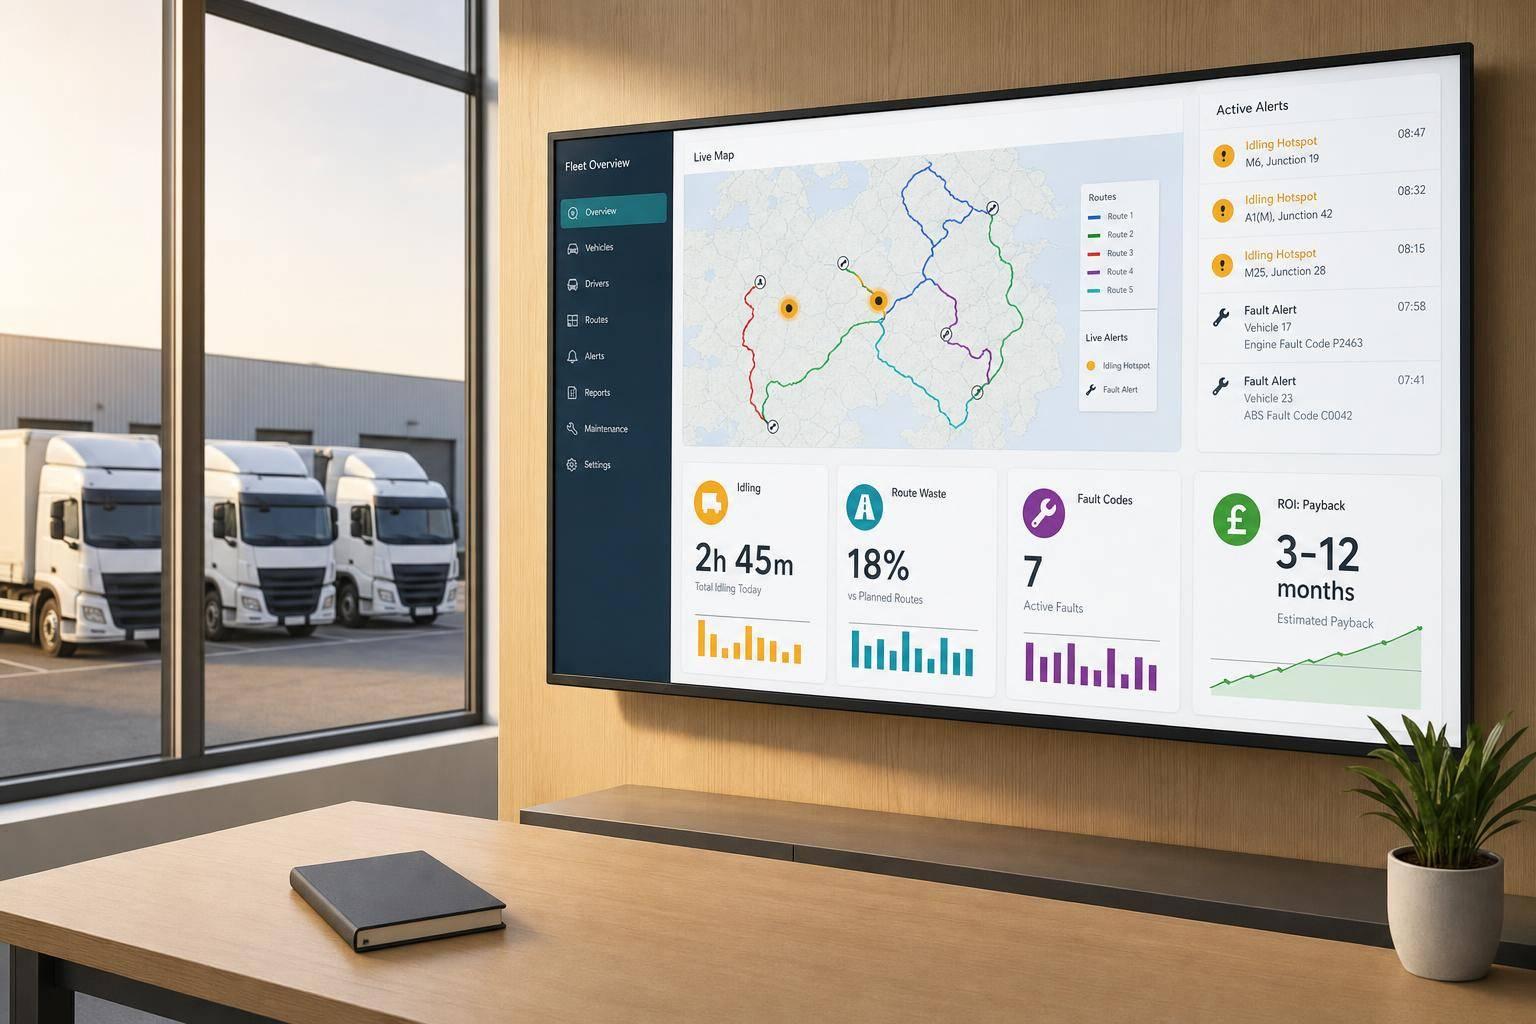
Alerts help here too. If the system flags route deviation, long idling, or ETA slippage, dispatch teams can focus on the vans that need attention instead of staring at every vehicle all day. And when ETAs are accurate, teams can warn customers before a delivery or visit is missed.
Where GRS Fleet Telematics fits
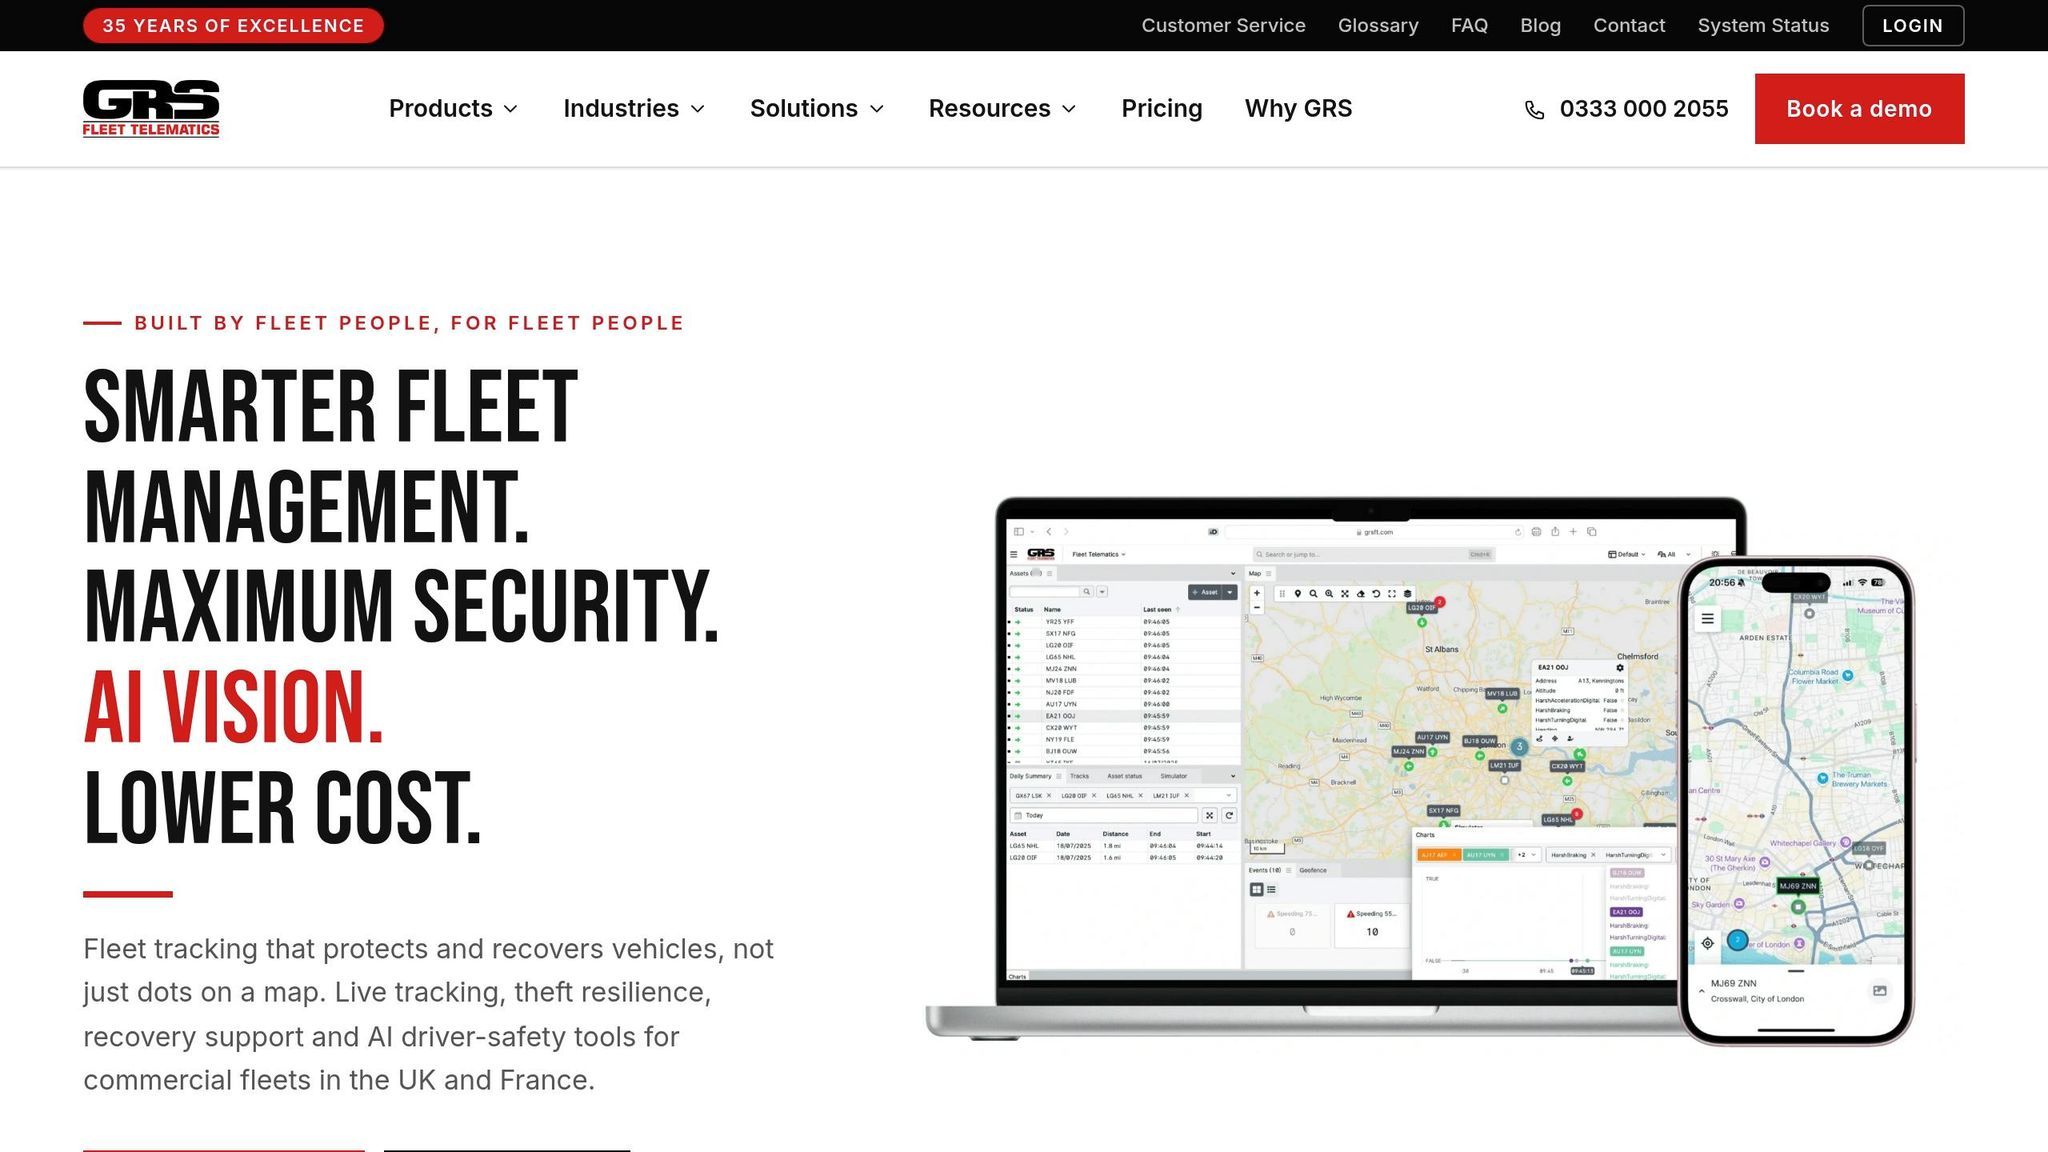
GRS Fleet Telematics supports both route planning and same-day dispatch by putting planned and actual performance side by side in one place. Its tracking devices collect precise location and movement data, which feeds route analysis and helps managers build schedules that reflect how vans perform on actual roads, not just in a plan.
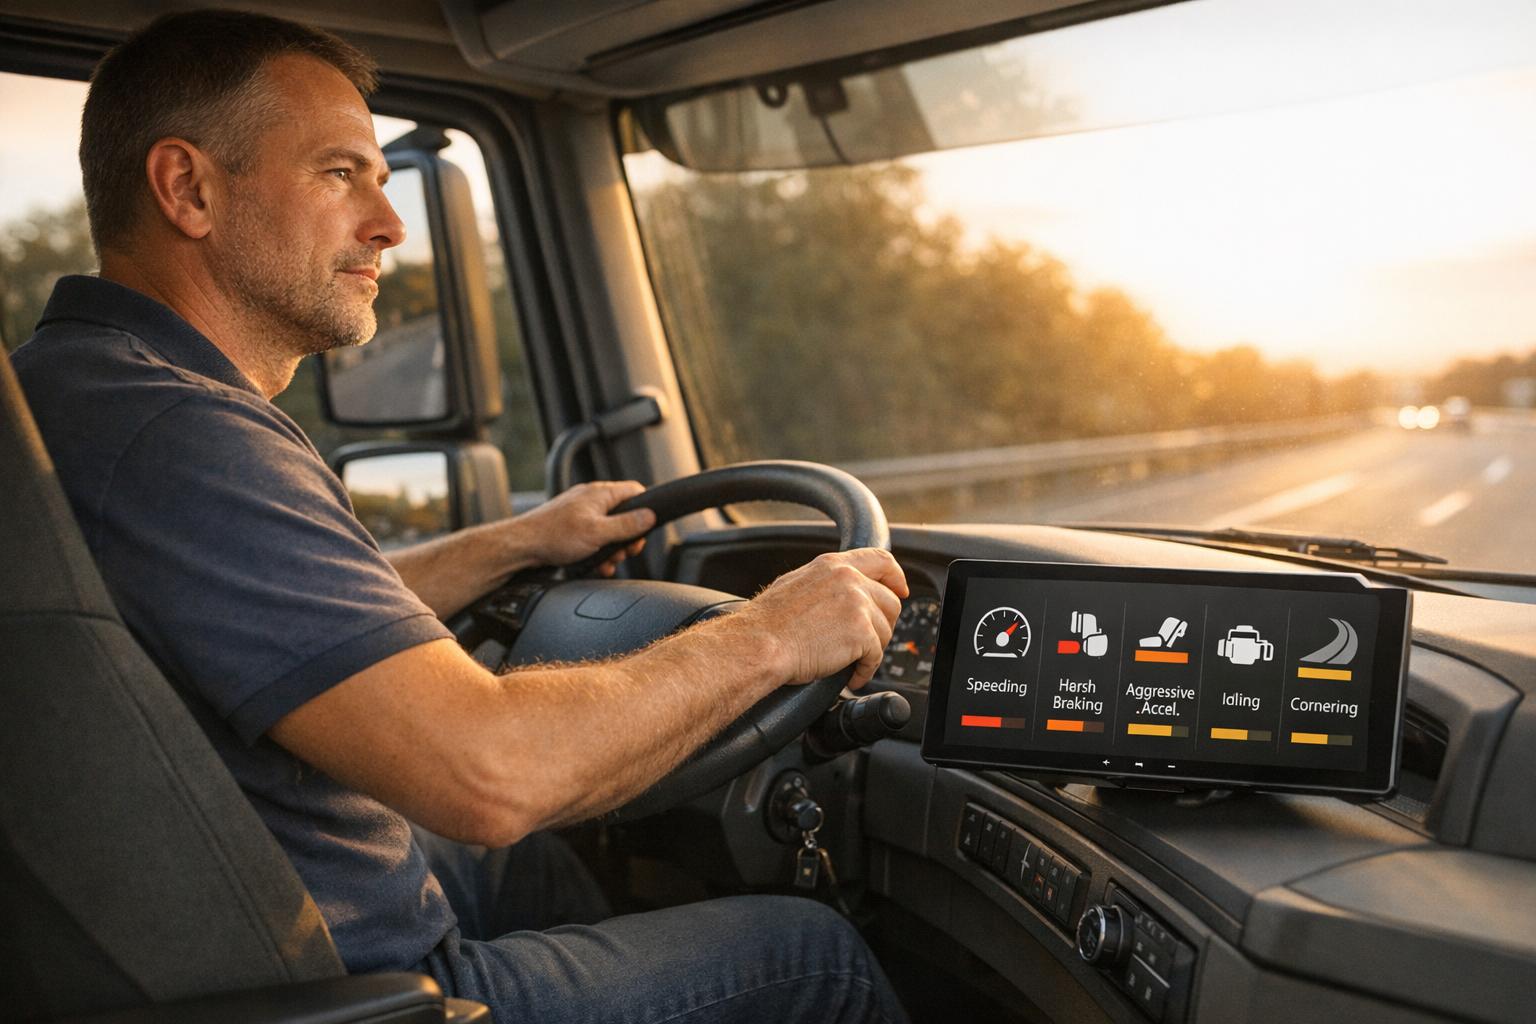
Route metrics also sit next to driver-behaviour data, including speeding, harsh acceleration, and idling. That means managers can see not only where time and mileage are being lost, but what’s driving it.
Which route metrics deliver the biggest cost savings
Fuel trends by route, driver and stop pattern
Routes can look similar on a map and still use fuel very differently. That’s why it helps to track fuel per mile by route, idle minutes, and analysing driver behaviour events. Those numbers show which jobs drain cash fastest. In many fleets, the biggest savings don’t come from the most obvious routes. They come from the runs, stop patterns, and drivers that seem minor day to day but quietly add cost across a full week.
A good place to start is fuel cost per completed drop across the fleet. With telematics data, you can split route problems from driver behaviour and deal with the right issue instead of guessing. According to Geotab, fixing driver behaviour issues alone can cut total fuel spend by around 6%. For a 20-van fleet spending £8,000–£9,000 a month on diesel, that works out at about £480–£540 saved each month.
Fuel data often shows something else going on underneath: vans are spending too much time standing still.
Dwell time and idle time as cost drivers
Idle time is one of the clearest fuel leaks in a fleet. Dwell time usually points to delays in the job itself. When both run high, the result is simple: wasted fuel, extra wages, and less room to fit in more work.
The numbers make the point fast. A diesel van can burn up to 3.5 litres per hour while idling. Fleet News cites data showing that a van idling for just one hour each working day can waste around £300 a year in fuel for a single vehicle. Teletrac Navman estimates that one hour of daily idling can cost over £1,000 per vehicle per year, or over £52,000 across a 50-vehicle fleet.
The most useful things to watch are:
- Idle minutes per stop
- Idle time as a share of total route time
- Stops where dwell runs past 15 minutes
When the same handful of sites keep showing long dwell and high idle, that usually signals a process issue, not a driver issue. Maybe vehicles are queuing at loading bays. Maybe site instructions are poor. Maybe delivery windows are set at the wrong times. That’s the kind of problem that eats money quietly. Coaching the driver might help a bit, but fixing the site process is what changes the result.
Missed turns, detours and route adherence
Route adherence data shows the gap between the planned route and the route that was actually driven. A missed turn here and a detour there may not sound like much. Across a fleet, though, they build up quickly. If each van in a 25-vehicle fleet drives just one extra mile per route because of navigation errors, and each van completes 20 routes a week, that adds up to around 2,000 extra miles a month across the fleet. That means more fuel, more tyre wear, and more paid driving time.
Here’s how the main adherence metrics link to day-to-day route problems:
| Metric | Common problem pattern | Operational effect |
|---|---|---|
| Missed turns | Drivers overshooting complex junctions on urban routes | Extra distance and time to loop back; missed time slots |
| Detour distance | Drivers taking familiar roads instead of the planned route | Longer drive times, higher fuel use, more driver hours |
| Route adherence % | Shows where planned routing is being ignored, increasing total route time | Fewer jobs completed per route; reduced daily capacity |
Once you can see these patterns, you can sort out routing, stop order, and driver guidance at the same time. But the data only pays off when managers use it in planning, driver briefings, and live dispatch.
Turning route data into lower fleet costs
Once route waste is visible, managers need a repeatable way to turn that insight into lower fleet costs.
A simple route-metrics workflow for managers
Route data only saves money when managers use it often and act on what it shows. A simple four-step workflow keeps things grounded and easy to repeat:
- Collect: Pull route data from all vans, including miles, journey time, idle time, dwell time, stop times and driving events.
- Rank: Score each route by cost leakage and wasted time. Flag the routes each month with the highest mileage per job, the longest dwell times or the most missed delivery windows.
- Act: Make targeted changes. That might mean re-sequencing stops, tightening delivery windows, bringing in no-idling rules, or updating navigation guidance for routes with repeated missed turns.
- Monitor: Track month-by-month changes in total miles driven, fuel consumed and overtime hours. Compare results against a baseline, ideally the previous three months, to check whether the changes are working.
Review routes on a fixed weekly or monthly schedule. That rhythm matters. It shows whether the changes are cutting spend or just looking good on paper.
How savings build across fuel, labour and maintenance
The savings from route metrics tend to build bit by bit across several cost areas at the same time. Lower mileage cuts fuel use. Less idling reduces wear. Smoother routes also help trim overtime and re-deliveries.
Industry case studies often report combined savings of around 10–30% in operating costs when telematics-driven route optimisation is used consistently. In one London-based distributor case, AI-assisted routing delivered a 30% drop in fuel spend, saving £252,000 a year alongside higher first-attempt delivery rates.
That’s the part many teams miss: the data itself doesn’t cut costs. Managers cut costs when they use the data, make changes, and keep checking the results month after month.
Key takeaways
In practice, route data only cuts costs when teams act on it every week. Route metrics show wasted fuel, time and mileage, and regular review turns that information into lower day-to-day running costs. GRS Fleet Telematics supports this workflow with live tracking, historical route replay, idling and dwell-time reports, and route adherence data - available from £7.99 per month.
FAQs
Which route metrics should I track first?
Start with three core areas: efficiency, delivery performance, and driver safety.
For efficiency, track fuel use and idling. For delivery performance, look at on-time arrival rate. For safety, watch harsh braking, rapid acceleration, and speeding.
Review these KPIs every week. That gives you a clear view of patterns over time, helps cut day-to-day running costs, and improves return on investment.
How quickly can route data reduce fleet costs?
Fleet managers can often see the impact fast. Some operators have hit return on investment in as little as 0.3 months, while most businesses tend to see full payback within 6 to 12 months.
That speed matters. When managers track figures like fuel cost per mile and idling time over 4 to 8 weeks, patterns start to show up. Maybe a route is wasting fuel in stop-start traffic. Maybe vehicles are sitting idle longer than expected.
Once those weak spots are clear, managers can adjust routes and cut wasted time on the road. The result is simple: measurable savings that show up in day-to-day fleet costs.
How does telematics separate route issues from driver issues?
Telematics works by comparing planned routes and targets with what vehicles actually do on the road. GPS tracking shows when a vehicle leaves its planned route, and it helps managers spot whether delays came from traffic, roadworks, or customer requests.
Driver-related issues are tracked separately. That includes behaviour such as harsh braking, rapid acceleration, speeding, and idling. This makes it easier for managers to tell whether higher costs or delays are down to the route itself or the driver behind the wheel.