
Van Downtime Costs UK Fleets: Data Summary
Explains true van downtime costs—direct and indirect—uses a £1,172/day benchmark and shows how to calculate and reduce fleet losses.

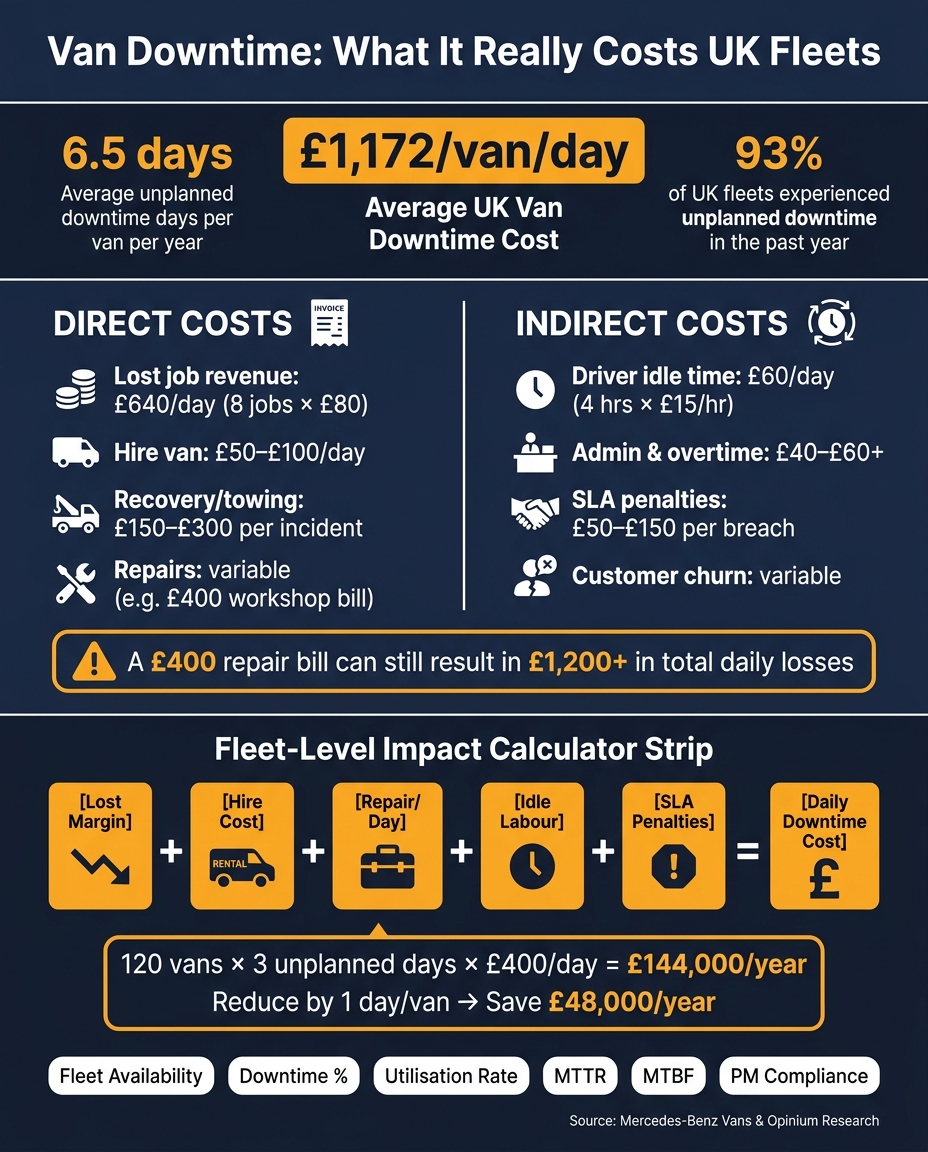
One van off the road can cost about £1,172 a day - but your own figure may sit lower or higher.
If I strip the article down to its main point, it’s this: van downtime is usually much more than the repair bill. The total cost can include lost jobs, hire vans, driver pay, overtime, recovery, SLA fines, and unhappy customers. The cited benchmark is £1,172.20 per van, per day, with 6.5 downtime days a year on average in the Mercedes-Benz Vans study.
If I were putting this into plain terms for a fleet manager, I’d focus on four things:
- Use £1,172 as a benchmark, not a fixed rule
- Split costs into direct and indirect costs
- Work out your own daily cost from jobs, labour, hire and penalties
- Track the right KPIs and reason codes so you can price downtime properly
A few figures stand out straight away:
- £600 to just over £1,000 per day is where other UK studies often place van downtime
- 80–120 parcels can be missed in multi-drop if one van is unavailable
- 5–8 chargeable jobs can be lost in field service in a single day
- £50–£100 a day is a common replacement hire range
- £150–£300 can be added by one recovery call-out
- 93% of fleets are said to have faced unplanned downtime over the past year
What matters most is this: I wouldn’t judge downtime by workshop spend alone. A £400 repair can still turn into a much bigger daily loss once missed work and labour waste are added in.
Here’s the simple calculation the article is built around:
Daily downtime cost = lost margin + hire cost + repair cost per day + idle labour + SLA or customer credits
And at fleet level:
Annual downtime cost = number of vans × unplanned downtime days per van × daily downtime cost
A short example from the article makes the point well. If 120 vans each lose 3 unplanned days a year, at £400 per day, that works out to £144,000 a year. Cut downtime by one day per van, and the saving is £48,000.
If I were benchmarking a fleet, I’d make sure the data set includes:
- jobs scheduled vs jobs completed
- hire days and hire cost
- repair and recovery spend
- driver idle hours and overtime
- SLA fines and customer credits
- planned vs unplanned downtime
- fault and delay reason codes
- depot, vehicle group and contract type
The article also makes the case for measuring fleet performance with a short KPI set, including:
- fleet availability
- downtime percentage
- utilisation
- MTTR
- MTBF
- preventive maintenance compliance
Bottom line: I’d treat the headline figure as a starting point, then build a monthly model from my own fleet’s data. That gives a much clearer view of what each lost van day is actually costing.
Van Downtime Costs UK Fleets: Key Stats & Daily Cost Breakdown
Is Your Fleet Bleeding Money
sbb-itb-499a7f0
What makes up van downtime costs
The £1,172.20 benchmark is a total figure, not one invoice. It blends direct and indirect costs, which means repair spend shows only part of the damage. If you want a clear picture, split downtime into those two buckets and track each one across your own fleet.
Direct costs: lost jobs, hire vans and repair spend
The easiest costs to spot are the ones that land on a bill. When a van is off the road, the direct hit usually comes from lost job revenue, replacement hire, and repair or recovery spend.
Lost revenue is often the biggest part of the total. If a van is out of action, the jobs it should have done that day are either lost altogether or pushed onto another vehicle at extra cost. Then there’s hire. A replacement van can add up fast. Repair, recovery and diagnostic charges can pile on as well, with a recovery call-out sometimes adding £150–£300 for a single incident.
Indirect costs: staff delays, SLA penalties and customer fallout
Repair invoices never tell the whole story. Some of the cost sits in wasted time, service issues and customer friction, even if it never appears on one neat document.
If a van is unavailable, a driver may be left waiting while the business scrambles to source a replacement. A driver paid £15 an hour who loses four productive hours costs £60 in wasted labour before overtime is even counted. On top of that, schedulers and admin staff spend time rerouting jobs, calling customers and rebuilding the day’s plan. That time costs money too.
SLA penalties add another layer. Around 47% of businesses reportedly face fines or penalties when vans are unavailable for a week, while 24% report customer complaints or missed performance targets tied directly to downtime. If the same problems keep happening, customer relationships can suffer and contracts can slip away.
Direct vs indirect downtime costs: comparison table
The table below shows how each cost area can be priced on a daily basis or per incident for a typical UK fleet operation.
| Cost type | Category | Example £/day or per incident (UK) | Notes |
|---|---|---|---|
| Direct | Lost job revenue | £640 | Eight jobs at £80 each. |
| Direct | Hire van (medium panel) | £50–£100 | Typical UK daily range; £75/day is a useful working assumption. |
| Direct | Repairs (labour + parts) | Variable | Repair invoices are case-specific; for example, the research cites a £400 workshop bill. |
| Direct | Recovery/towing | £150–£300 per incident | A recovery call-out can fall in this range and may be spread across the downtime days. |
| Indirect | Driver idle time | £60 | Four productive hours lost at £15/hour. |
| Indirect | Overtime and replanning | £40–£60, plus overtime | Admin re-planning can add £40–£60, with catch-up overtime on top. |
| Indirect | SLA penalties | £50–£150 per breach | Per-incident charge for missed delivery or service windows. |
| Indirect | Customer complaints and churn | Variable | Customer fallout can extend beyond the downtime event. |
Put side by side, these numbers show why a £400 workshop invoice can exist at the same time as a daily downtime cost of more than £1,200. The next move is to map these cost types against your own job values, labour rates and hire spend.
How to calculate downtime cost using your own fleet data
You can turn those cost buckets into your own number: a fleet-level daily downtime cost that mirrors the £1,172 benchmark, but uses your own missed jobs, idle drivers, hire vans and customer credits.
Basic formulas for cost per downtime day
Start with one van. Use the same cost buckets already set out: lost margin, hire van cost, repair cost per day, driver idle time and SLA penalties.
Daily downtime cost (£/van) = Lost margin per day + Hire van cost per day + Repair cost per day + Driver idle time cost + SLA penalties
Here’s how the core inputs work:
- Lost margin = jobs per van per day × contribution per job
- Driver idle time = fully loaded hourly rate × idle hours
- Repair cost per day = workshop invoice ÷ days off the road
Then scale that per-van number across the fleet:
Annual downtime cost (£) = Number of vans × Average unplanned downtime days per van per year × Daily downtime cost per van
A simple example makes the maths easy to see. If a fleet of 120 vans averages three unplanned days off the road per year, and each day costs £400, the annual downtime cost is £144,000. Cut that average to two days, and the saving is £48,000. That’s the sort of number that gives preventive maintenance a clear business case.
The data inputs UK fleet managers should gather first
Most of the data is already there. The hard part is pulling it together from different systems.
Average jobs per van per day usually sits in your route planning or job management platform. Contribution margin per job comes from finance or your costing model. Hire rates sit in procurement records. Driver hourly cost, fully loaded, comes from payroll. Idle hours can often be taken from telematics or timesheets. Penalty charges and customer credits usually sit with finance and account management.
One input often gets missed: the planned vs unplanned split for days off the road. That split matters more than people think. If you keep planned servicing separate from unplanned breakdowns in your workshop or maintenance system, you get a much cleaner view of disruption cost. This distinction is vital for reducing fleet maintenance costs over the long term. Unplanned downtime is where the pain usually lands - emergency hire, idle drivers and SLA breaches - so folding routine servicing into the same figure can blur what’s going on.
Sensitivity table: how changing key assumptions affects the daily cost
The table below shows how daily cost per van can move across three scenarios.
| Cost item | Best case (£) | Base case (£) | Worst case (£) |
|---|---|---|---|
| Lost margin per day | 120 | 180 | 260 |
| Hire van cost per day | 60 | 90 | 140 |
| Driver idle / overtime cost | 50 | 80 | 130 |
| Repair cost per day | 40 | 70 | 110 |
| SLA penalties / customer credits | 0 | 80 | 200 |
| Total daily downtime cost | 270 | 500 | 840 |
Use the table as a stress test, then swap in your own rates and downtime patterns. From there, the job is to track the KPIs and data fields that make the model accurate.
What UK fleets should measure to benchmark downtime accurately
KPIs that expose downtime risk across your fleet
Once you have a cost model in place, the next job is simple: decide which numbers you’ll track every time. The exact number matters less than the method. If every depot, vehicle group and contract is measured in the same way, you can compare like with like across the fleet.
To benchmark downtime properly, start with the operational KPIs that show whether vehicles are available, earning and getting back on the road fast.
| KPI | Formula | What it tells you |
|---|---|---|
| Fleet availability | Available vehicles ÷ total fleet × 100 | How much road time you are losing across the fleet |
| Downtime percentage | Downtime hours ÷ planned operating hours × 100 | Proportion of scheduled time lost across the fleet |
| Utilisation rate | Active hours ÷ total available hours × 100 | How intensively available vehicles are actually being used |
| Mean Time To Repair (MTTR) | Total repair time ÷ number of repair events | How quickly loss is being recovered after a fault |
| Mean Time Between Failures (MTBF) | Total operating hours ÷ number of failures | How often unplanned breakdowns occur |
| Preventive maintenance compliance | Completed PMs on time ÷ total scheduled PMs × 100 | Whether preventive maintenance is keeping pace with the plan |
Reported starting benchmark targets for higher-performing fleets include ≥92% vehicle availability and 95%+ preventive maintenance compliance, though these vary by fleet type and working pattern. Track each KPI by depot, vehicle group and contract type to show where downtime risk is piling up.
Once those KPIs are in place, the next step is linking missed activity to actual cost.
Data fields that link missed jobs to real cost
KPIs show the pattern. Data fields show the cost.
Capture scheduled vs completed jobs, reason codes, hire days, reassignment hours, overtime and service failures. That’s the difference between saying a van was off the road and showing what that lost day did to the operation.
Reason codes matter more than most fleets think. A controlled list - covering categories such as mechanical breakdown, electrical fault, tyre failure, accident damage, MOT failure and parts delay - helps you split avoidable downtime from events you couldn’t have planned for. Without reason codes, downtime is hard to pin down. With them, you can connect repeat faults, parts delays and depot issues to specific cost drivers.
How telematics supports downtime measurement
Telematics records engine on/off events, location, idle time and trip history, giving you a clear log of vehicle availability. GRS Fleet Telematics provides real-time van tracking with dual-tracker technology and stolen-vehicle recovery support, helping fleets measure downtime more accurately. That gives you the evidence you need to compare the benchmark with your own fleet.
Taken together, these measures turn downtime from a headline figure into a cost you can track by vehicle, depot and incident type.
Conclusion: turning a research benchmark into a fleet action plan
Use the KPIs and data fields above to turn this benchmark into a monthly cost model for your own fleet. The £1,172.20 per van per day figure from Mercedes-Benz Vans and Opinium research gives you a clear starting point. One day off the road can turn into a serious disruption very fast.
And the workshop invoice is only one part of the story.
In many cases, the bigger hit comes from the knock-on costs around the repair itself, such as:
- missed jobs
- hire vans
- labour time
- SLA penalties
Once you can measure downtime properly, you can start cutting it. Build your baseline from job, hire and labour data. Then review it each month by depot or vehicle group. That makes it much easier to spot which downtime events cost the most.
A telematics system such as GRS Fleet Telematics can help here by giving you remote diagnostics and time-stamped records of breakdown, recovery and return to service. With that data in front of you, you can adjust maintenance schedules, replacement cycles and fault escalation based on what is hitting your fleet hardest.
FAQs
How do I calculate my own downtime cost per van?
Add up your direct and indirect costs. That means maintenance, repairs, insurance, tax, leasing fees, and driver wages.
Then go a step further. Include the money you lose from missed jobs, replacement hire vehicles, and the admin time spent dealing with breakdowns and moving work around.
If you want a figure that’s closer to the truth, use 12 months of past data. Good sources include:
- Fuel records
- Maintenance logs
- Telematics reports
You can also measure downtime as a percentage with this formula:
downtime hours ÷ total available hours × 100
That gives you a simple way to see how much working time your vehicles are losing.
Which costs are most often missed in downtime reporting?
The costs people miss most often aren’t the repair bills. They’re the knock-on productivity and disruption costs that hit once a van is off the road.
That usually means things like:
- paying drivers while vans can’t be used
- missed jobs or delivery slots
- emergency hire or replacement vehicles
- overtime, rushed labour, or rush-ordered parts
- customer impact, including relationship, contract, or compliance issues
What data should I track to reduce van downtime?
Track vehicle health and usage signals that can point to faults before a breakdown happens. That includes engine diagnostics, temperature, oil pressure, coolant levels, fan activity, battery charging health, brake wear, tyre condition, mileage, engine hours, idling, and stop-start use.
It also helps to track day-to-day delays across the fleet, such as route adherence, journey duration, stop dwell time, idle minutes per stop, and on-time arrival rate. When an alert comes in, connect it to workshop bookings so the next step is clear. Alongside that, monitor downtime hours and maintenance compliance.