UK Van Theft Data: Tracker Study Summary
11,273 vans stolen in 2024; tracked vans recover 95–98% vs 39% untracked—prioritise trackers by model, area and use.
 By Michael Bar13 min read
Van theft still hits hard: about 11,273 vans were stolen in 2024, only 39% were recovered without tracking, and tracked vans reached 95–98% recovery in the data cited.
If I boil the study down, the message is simple: theft risk is uneven, predictable in parts, and easier to cut when I match tracker setup to the vans most at risk. The main pressure points are high-theft areas such as London, South Yorkshire, West Yorkshire, Hertfordshire and Essex, high-risk models such as the Mercedes Sprinter and Peugeot Boxer on a per-van basis, and work patterns like on-street overnight parking or multi-drop city routes.
Here’s the article in plain English:
- The scale is still high: around 31 vans a day were stolen in 2024.
- Losses go beyond the van: tool theft, missed jobs and downtime often do more damage than the vehicle value alone.
- Recovery is the big split: untracked vans recover at about 39%, while tracked vans in the cited data recover at 95–98%, often within 2 days.
- Some vans face more risk per vehicle: the Peugeot Boxer (7.7 per 1,000) and Mercedes Sprinter (7.5 per 1,000) rank above the Ford Transit (5.8 per 1,000) on theft rate.
- Some places and times are worse: hotspot postcodes and darker months, especially around October, need tighter after-hours controls.
- Trades and delivery fleets face different risks: tool-carrying vans often get hit overnight, while courier fleets face theft during short daytime stops.
- The tracker setup should match the risk: basic live tracking may suit lower-risk vans, while higher-risk vans need dual tracking, tamper alerts, geofences, ignition alerts and sometimes remote immobilisation.
- Policy matters as much as hardware: named alert contacts, stop-time rules, geofences for depots and home parking, and incident logs all help cut loss and downtime.
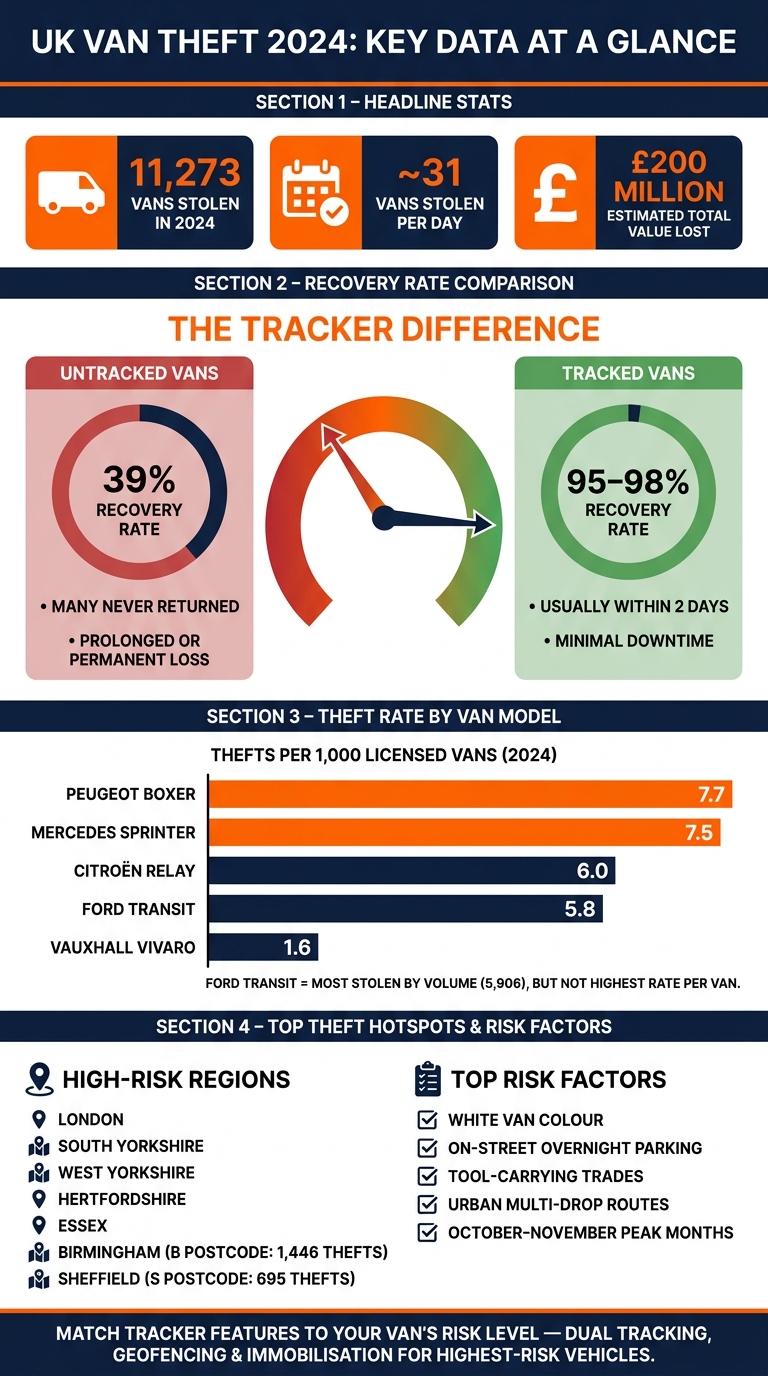
UK Van Theft 2024: Tracked vs Untracked Recovery Rates & High-Risk Models
Quick comparison
| Area | What the data says | What I’d do |
|---|---|---|
| Theft volume | 11,273 vans stolen in 2024 | Treat theft as a fleet risk, not a rare event |
| Recovery | 39% untracked vs 95–98% tracked | Put tracking first on higher-risk vans |
| High-risk models | Sprinter and Boxer rank high per 1,000 vans | Start with those models if budget is tight |
| High-risk use | Tool-carrying trades, urban multi-drop fleets | Add alerts and tighter parking rules |
| Hotspots | London, South Yorkshire, West Yorkshire, Hertfordshire, Essex | Use postcode-based geofences and after-hours alerts |
| Feature fit | Live tracking, geofencing, tamper alerts, immobilisation | Match features to the van’s theft score |
Bottom line: if I’m running a fleet, I’d rank each van by model, area, use, tool value and overnight parking, then give the highest-risk vehicles the strongest tracker cover first.
UK van theft numbers and recovery rates
In 2024, 11,273 vans were reported stolen across the UK, with an estimated combined value of about £200 million. That works out at roughly 31 vans a day. Those numbers are hard to ignore. But theft volume is only part of the picture. What often hits fleets harder is the recovery rate.
How theft volume changed from 2024 to 2025
Direct Line analysis suggests van theft fell 16% from 2024 to 2025, with incidents shifting from around one van every 44 minutes to roughly one every 52 to 55 minutes. That's a step in the right direction, but it doesn't mean the problem has gone away.
Even at 9,522 thefts, vans used in cities and higher-risk trades still face clear exposure. For fleet operators, the main issue isn't only how often theft happens. It's what happens after a van disappears.
Recovery rates: untracked vans versus tracked vans
The recovery data makes the difference plain.
Direct Line's 2024 analysis found that only 39% of stolen vans were recovered by police. In other words, roughly six in ten stolen vans were never returned to their owners.
| Scenario | Recovery rate (%) | Recovery time | What it means for fleet risk |
|---|---|---|---|
| Untracked vans | ~39% | Often prolonged; many never recovered | High chance of total loss and long downtime. |
| Tracked vans | 95–98% | Usually within 2 days | Most vehicles are recovered fast, cutting write-offs and disruption. |
For fleet managers, the gap between 39% and 95–98% isn't small. It's the gap between a temporary problem and losing an asset for good. The next issue is which vans and regions tend to draw the most theft.
Which vans are targeted and where theft risk is highest
The van models most often stolen
Some vans get stolen more often simply because there are more of them on the road. But for security planning, the more useful figure is the theft rate per 1,000 licensed vans.
The Ford Transit leads by total thefts. In 2024, around 5,906 Transits were stolen, which was roughly 52% of all van thefts recorded that year. But when you look at the rate per 1,000 vans, the picture shifts.
| Van model | Number stolen (2024) | Thefts per 1,000 licensed vans |
|---|---|---|
| Ford Transit | 5,906 | 5.8 |
| Mercedes Sprinter | 1,492 | 7.5 |
| Peugeot Boxer | 524 | 7.7 |
| Citroën Relay | 405 | 6.0 |
| Vauxhall Vivaro | 423 | 1.6 |
Sources:
That matters in practice. A fleet with a small number of Peugeot Boxers or Mercedes Sprinters may face more theft exposure, van for van, than a fleet made up mostly of Transits. So if you're deciding where to start, it makes sense to put dual trackers or immobilisers on the higher-rate models first. It’s a simple way to sort which vehicles need the strongest tracker setup before the rest.
Why white vans and certain regions face higher theft risk
White vans show up more often in theft data, so colour is worth treating as a risk marker. Bedfordshire, the West Midlands, Birmingham, Sheffield and Guildford keep appearing as hotspots. In those places, geofenced overnight parking and after-hours alerts deserve extra attention.
Parking can change the risk level fast. A lower-risk model left overnight on the street in one of these areas may become a much easier target. In plain terms, where a van sits after hours - especially in a dark, open or unsecured spot - can matter just as much as the badge on the grille.
Seasonal and local theft patterns
The timing shifts from year to year. In 2024, thefts spiked in January, March and April. In 2025, the peaks came in July, October and November. That gives fleets a clear window to tighten alerts, review parking rules and step up checks before higher-risk periods begin.
It also helps to separate vehicle theft from tool theft. Tracker recovery can help with the first. Secure storage helps with the second. Many tradespeople deal with both at once, especially when vans are left loaded overnight or parked between jobs.
The best way to rank risk is to combine national hotspot data with your own depot postcodes, parking habits and incident history. Those model and location patterns set up the next issue: which fleets carry the most day-to-day exposure.
High-risk trades and fleet use cases
The theft patterns make a lot more sense when you line them up with how fleets are used day to day.
Tradespeople, tools and the cost of van theft
For builders, electricians, plumbers and carpenters, a van isn't just transport. It's a mobile workshop. So when it gets stolen or broken into, the hit comes from two sides at once: the van itself and everything stored inside it.
Aviva found that the average work van carries more than £4,300 worth of tools and materials. On top of that, vehicle damage can add around £750 per break-in. Once downtime is factored in, the total cost of a serious incident will often go beyond £4,250. And for some tradespeople, the loss is much worse. One survey found that nearly one in five victims lost more than £5,000 worth of tools in a single theft.
Direct Line recorded 12,414 tool thefts from vehicles in 2024 alone. That worked out to roughly 49% of all tool thefts across the UK. Even so, 78% of tradespeople and contractors say they leave tools or machinery in their van overnight. That's a major reason some vehicles keep getting hit.
For these fleets, vehicle recovery on its own isn't enough. Tool cover and van tracking need to work together.
Different working patterns also create different theft windows.
Delivery, logistics and high-stop urban routes
Delivery and multi-drop fleets deal with a different kind of risk. The weak points often show up during the day, not just overnight.
A city-centre route with dozens of stops creates dozens of short openings for theft. Then, if the van is left on the street overnight in a hotspot, the risk jumps again.
This is where a few tracker functions earn their keep:
- Geofencing to flag vans entering high-risk areas outside planned hours
- Movement alerts to spot use when a vehicle should be parked
- Route-deviation monitoring to pick up odd detours before they turn into a bigger issue
For example, a geofence around a high-risk borough can alert you if a van enters that area outside its scheduled hours. A route-deviation alert can flag an unexpected detour before it becomes a bigger problem.
A simple fleet risk-tier breakdown
This is why risk-tiering is such a practical way to assign the right level of cover to each van.
| Industry or use case | Primary asset at risk | Common theft pattern | Recommended tracker features |
|---|---|---|---|
| Builders / carpenters / joiners | Power tools, hand tools and fixings | Overnight van break-ins at home or on-street; opportunistic theft at short stops | Real-time tracking, out-of-hours movement alerts, geofencing around home postcodes, immobilisation |
| Electricians / plumbers / heating engineers | Specialist tools, diagnostic equipment and components | Repeat targeting of known vehicles; overnight street or site parking | Dual tracking, tamper alerts, depot geofences, driver ID |
| Multi-drop delivery / couriers | Vehicle, parcels and goods in transit | Short kerbside stops in city centres; overnight street parking in urban hotspots | Route deviation monitoring, high-frequency location updates, geofences for high-risk zones |
| Construction site support | Mixed tools, small plant and high-value kit | Theft from temporary sites and lay-bys; organised targeting of specialist equipment | Movement alerts, site perimeter geofences, integrated van tracking |
The highest-risk tier - trades vans carrying expensive tools and parked on-street overnight in urban areas - calls for the strongest setup, including dual tracking and immobilisation. Lower-risk vehicles can often be handled with standard GPS tracking and alerts. The key is simple: match the level of protection to the level of exposure.
Those risk tiers lead straight to the tracker features that matter most.
Tracker and telematics features that support van recovery
Tracker features only help when they line up with the theft risk. That big gap between untracked and tracked recovery rates shows why feature choice matters. So the key question isn’t whether to track a van. It’s which features help you recover it fast.
Real-time tracking, geofencing and out-of-hours alerts
Real-time GPS tracking, geofencing and out-of-hours alerts give fleets an instant warning when a van moves when it shouldn’t. A map on its own is passive. Live alerts give you something to act on. The goal is simple: spot the theft early, before the van gets far.
Geofencing creates a virtual boundary around a depot or overnight parking spot. If the van leaves that area outside approved hours, the system sends an instant alert.
Motion and tamper alerts add another layer. They can pick up movement without ignition, or flag power loss, which helps catch towing and tampering before the van has gone far. The sooner those alerts reach the right person, the sooner they can work with police and start a response.
Dual tracking and immobilisation for higher-risk vans
Dual tracking adds a second device as backup, so a thief can’t shut down the whole system by finding and removing one tracker. That matters because organised theft often goes after the tracker first. If the stolen van later comes to a stop, remote immobilisation can disable the engine from a distance, making it much harder to drive away again.
GRS Fleet Telematics offers dual-tracker and immobilisation options, with pricing from £7.99 per month.
Matching tracker features to fleet security outcomes
The table below turns recovery data into a practical shortlist. It links each feature to the risk it helps cut.
| Tracker feature | Security purpose | Best-fit theft risk | Operational benefit |
|---|---|---|---|
| Real-time GPS tracking | Continuous live location | All theft types; baseline protection | Faster police response |
| Geofencing | Alerts when a van crosses a virtual boundary | Depot departures; hotspot zone movement outside hours | Earlier detection |
| Out-of-hours ignition alerts | Flags engine start outside approved windows | Overnight theft from street or site parking | Immediate alert |
| Motion / tamper alerts | Detects movement without ignition or power loss | Towing; tracker removal attempts | Catches tow-away thefts early |
| Dual tracking | Backup location source if the primary device is removed | Organised theft; tracker sabotage | Better recovery cover |
| Remote immobilisation | Disables the engine once the vehicle is stationary | High-risk vans; tool-carrying vehicles in hotspots | Limits onward movement |
The takeaway is straightforward: alerts need to reach someone who can act at once. That response time is what turns theft data into a working security policy.
Building a data-driven fleet security plan with telematics
How to prioritise vehicles using theft data and telematics
Use the risk tiers above to decide which vans need the strongest controls first. In most fleets, theft risk isn't spread evenly. Some vans are far more exposed than others, so treating every vehicle the same doesn't make much sense.
A simple way to start is to score each van against six factors:
- model theft history
- colour
- trade use
- tool value
- operating area
- overnight parking location
Each factor adds weight to the van's total risk score. For example, a white Ford Transit used by an electrician and left on-street overnight would rank high across all six factors. A van parked in a monitored depot would rank lower. Once you've built that list, give the top-tier vehicles the strongest setup first: dual tracking, tight geofences, ignition alerts and, where it fits, remote immobilisation.
Recent theft data shows that risk is concentrated. So the higher-risk vans should get tougher controls first.
Once the vehicles are ranked, the next step is to turn that score into location rules.
Setting policies for hotspots, depots and after-hours movement
Use separate geofences for depots, home parking and customer sites, with tighter settings for each. A depot geofence of around 30–50 metres with a weekday curfew of 18:00–06:00 gives fleet managers a clear rule they can monitor and audit.
For urban multi-drop routes, dwell-time data can help spot vans that are sitting too long in high-theft postcodes. Birmingham's B postcode area alone recorded 1,446 thefts in the period reviewed, followed by Sheffield (S) with 695 and Guildford (GU) with 577. Set a maximum unattended stop time in higher-risk postcodes, then send alerts to the dispatcher on duty. That way, the postcode data becomes a live control instead of just a line in an old report.
After-hours ignition alerts should go to a named person who has a clear response script: verify with the driver, check against planned jobs, escalate to police if unaccounted for. Incident logs for every geofence breach, tamper alert and ignition event should be kept complete and reviewed on a regular basis. They matter when dealing with post-theft insurance claims and police liaison.
Conclusion: Key findings fleet managers should act on now
For the highest-risk vans, dual tracking, live alerts and immobilisation justify the cost. That puts policy, not guesswork, at the centre of fleet security. Telematics turns theft data into a clear security policy.
FAQs
Which vans should I prioritise first?
Prioritise the vans most likely to be stolen first.
That usually means focusing on:
- Older vans aged five to 10 years, which account for 39% of thefts
- Vans operating in high-risk areas such as London and the West Midlands
- High-value vans carrying expensive tools or materials
It also makes sense to move up any vehicle that often travels through, visits, or is parked in places with a strong history of van theft.
What tracker features matter most?
The most important tracker features for van fleet security are dual-tracker technology, geofencing and remote immobilisation.
Dual trackers help keep tabs on a van if the main unit is tampered with or knocked out. Geofencing sends instant alerts when a vehicle moves without permission outside set hours. And remote immobilisation can shut down the engine, fuel pump or starter motor to help stop theft while it’s happening.
How can I reduce overnight theft risk?
Use a multi-layered security approach. Since 78% of thefts happen in the evening or at night, geofencing can send an SMS or app alert if a van leaves an approved depot or parking area during restricted hours.
Remote immobilisation can help stop unauthorised movement. And dual-tracker technology, paired with 24/7 monitoring, gives you a better chance of keeping the van traceable if the main system is compromised.