
Driver Performance Monitoring for Delivery Fleets
Track how drivers drive, not just location, to reduce collisions, fuel waste and failed deliveries with scorecards and UK GDPR privacy.
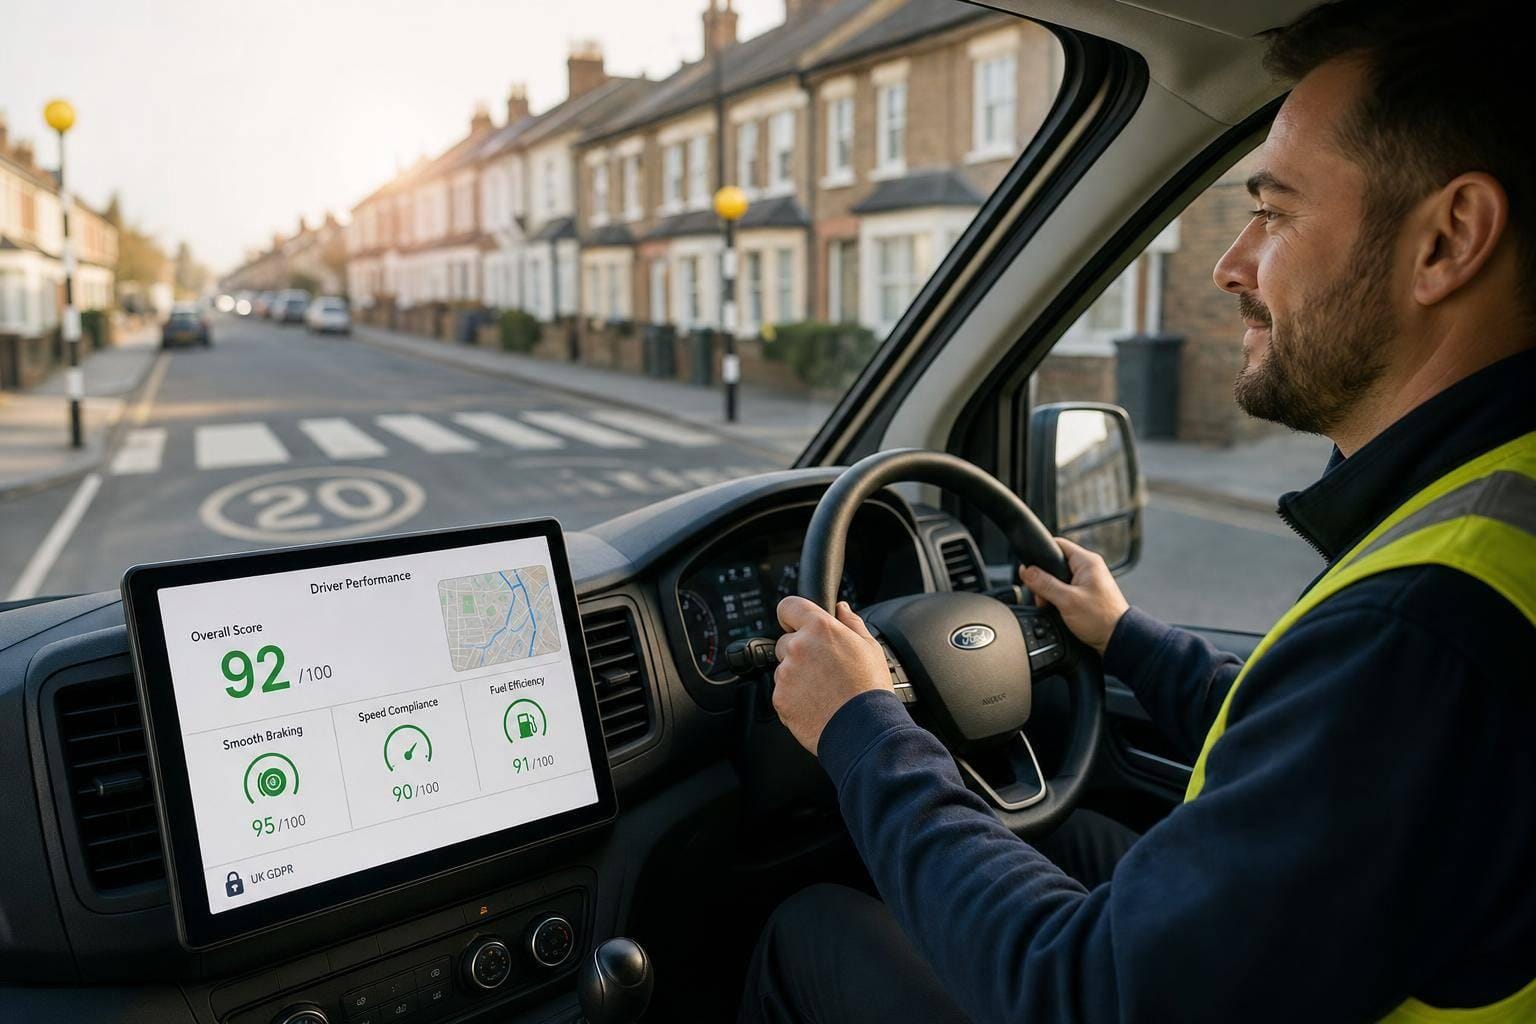
If you only track where a van is, you miss what drives cost, risk, and service problems: how the driver is driving.
I’d sum it up like this: a strong monitoring setup links telematics, scorecards, coaching, privacy rules, and security controls into one clear system. For UK delivery fleets, that matters because work-related road collisions made up 23% of all collisions and 29% of road deaths in Great Britain in 2025. So this isn’t just about maps on a screen. It’s about cutting crashes, fuel waste, claims, failed drops, and poor service.
Here’s the article in plain terms:
- I look at the difference between basic van tracking and driver performance monitoring
- I explain how telematics records speed, idling, harsh braking, acceleration, cornering, route use, and video-linked events
- I break down the driver and delivery metrics that matter most, such as:
- speeding
- harsh events per 100 miles
- seatbelt and distraction alerts
- idling
- off-route mileage
- on-time arrival
- first-attempt delivery success
- I show how to build a short 0–100 driver scorecard, with most of the weight on safety
- I cover how to compare drivers properly by using rates, route groups, and rolling averages instead of raw counts
- I explain the UK privacy side, including UK GDPR compliance, driver notices, DPIAs, retention periods, and access controls
- I also show how the same data can help with theft response, geofencing, tamper alerts, and daily fleet control
A few points stand out.
First, patterns matter more than one-off events. One harsh brake on a busy street may mean nothing. Repeated speeding or repeated harsh braking over 4–12 weeks is what needs action.
Second, safety should outrank service targets. If on-time delivery improves but speeding also climbs, the route plan is likely the problem.
Third, scorecards only work if drivers are compared with people doing similar routes and workloads. An urban multi-drop round and a longer trunk route should not be judged the same way.
And fourth, monitoring data needs tight rules around who can see it, why they can see it, and how long it stays in the system.
| Area | What the article focuses on | What good looks like |
|---|---|---|
| Safety | Speeding, harsh events, distraction, fatigue | Lower risk and fewer collisions |
| Cost control | Idling, fuel use, off-route miles | Less waste and lower spend |
| Service | On-time arrival, first-attempt success, dwell time | Better delivery performance |
| People & policy | Scorecards, coaching, dispute checks | Clear and consistent reviews |
| Data & security | Privacy notices, retention, geofences, theft alerts | Better control with proper limits |
If I had to reduce the whole article to one line, it would be this: the best fleet monitoring programmes track the right driving signals, score them in a simple way, review them with care, and use the data for coaching, planning, and security - not just surveillance.
How Large Fleets Actually Use Telematics to Improve Driver Safety
sbb-itb-499a7f0
How Telematics Devices Collect Driver Performance Data
Most van telematics devices rely on three main parts: a GNSS/GPS receiver, a 3-axis accelerometer, and a CAN bus link or OBD-II port. On stop-start delivery routes, those parts turn everyday driving into measurable events. For courier fleets, that means stop-start patterns, delivery pressure, and route changes can all be tracked in a consistent way.
What Van Trackers Record: Location, Speed, Idling, and Harsh Events
Hard-wired trackers connect to the vehicle's power supply, ignition, and CAN bus. OBD devices plug into the diagnostic port, which makes them a good fit for vehicles that move between drivers or operate on short contracts.
Each data point is time-stamped at source, so the system can rebuild a driver's journey minute by minute. Idling is usually logged when the ignition is on, engine data is present, and GPS speed stays close to zero for two to five minutes. Harsh braking, acceleration, and cornering come from the accelerometer. When G-forces pass a set threshold, the device records an event.
Those thresholds make a big difference. Typical default settings for light vans are around 3.5–4.0 m/s² for harsh acceleration and braking. Set them too low and the dashboard fills up with false positives from normal town driving. Set them too high and risky behaviour can slip through. A short pilot across a sample of vehicles on your actual routes helps sort this out. Review the event volume, then adjust before a full rollout. It also helps to use separate profiles for urban, suburban, and rural routes, because driving conditions change a lot across a normal courier patch.
How Video Telematics Adds Context to Risky Driving Events
A harsh braking alert at 10:32 shows what happened. A short video clip from that same moment helps explain why. Forward-facing cameras record the road ahead, so managers can see whether the driver was following too closely, reacting late to a hazard, or braking hard to avoid a pedestrian stepping into the road. Inward-facing cameras record the driver's posture and face, which can show distraction, mobile phone use, seatbelt non-use, and signs of fatigue such as drooping eyelids.
When a telematics event is triggered, the system can upload a short clip automatically - usually 10 to 20 seconds before and after the event - to the cloud platform, tied to that event by timestamp. That gives managers something more than a raw alert. They can review the clip straight away, coach faster, and cut down on disputes. It can also back up drivers when road conditions caused the event.
How Data Moves from the Van to Dashboards and Alerts
The tracker sends data through a mobile connection to the telematics platform. From there, the platform matches speed against digital speed limits, rebuilds trips, sorts events, and links video clips to each incident. What managers see is the part that matters day to day: live maps, improving driver performance panels, trend charts, and exception lists.
In rural areas, coverage gaps can delay live alerts, so multi-network SIMs help reduce those delays across mixed territories. Managers use that data feed to spot risk, coach drivers, and keep daily operations on track.
These data streams feed the safety, efficiency and service metrics covered next.
Which Driver Behaviours and Delivery Metrics to Monitor
Once telematics data starts flowing into your dashboard, the next step is simple: decide what actually deserves your attention. Not every signal matters equally. Focus first on the behaviours and delivery outcomes that affect crash risk, delivery pace, and customer results. If you try to track everything, you usually end up with noise. If you track the right things, you get something you can act on.
Safety-Critical Driving Behaviours That Increase Collision Risk
The first behaviours to watch are speeding, harsh braking, harsh acceleration, close following, seatbelt non-use, distraction, and fatigue. In commercial van fleets, these are linked to higher crash and claim risk.
Speeding is the clearest warning sign. Even small amounts over the limit increase both collision risk and crash severity. Repeated speeding also comes with a direct cost. Harsh braking and harsh acceleration can point to late reactions or poor judgement. Close following, usually flagged through video telematics or ADAS alerts, is one of the strongest signs of rear-end collision risk, especially in stop-start urban delivery work.
It helps to treat one-off events as context, not instant proof of a problem. What matters more is the pattern over time. Coach drivers based on repeated behaviour across weeks, not a single bad moment. Set thresholds by route type, then focus on drivers who stay above the fleet average.
Distraction and fatigue are tougher to spot without AI dashcams, but they still matter a great deal. Camera-detected phone use, eyes off the road, and drowsiness signs such as long continuous driving periods or lane-departure alerts can all be linked to timestamps and GPS locations. That makes repeat issues far easier to spot.
Once you’ve got safety covered, move to the route and service measures that show how deliveries are being carried out.
Delivery and Route Behaviours That Affect Speed and Service Levels
Safety data shows how a driver handles the van. Delivery data shows how well the job is being done. The most useful measures here are route adherence, off-route mileage, depot and customer dwell time, excess idling, on-time arrival, and first-attempt delivery success.
These figures come from combining telematics with dispatch records and proof-of-delivery data. Route adherence checks the van’s GPS trail against the planned route. Off-route mileage shows how far the vehicle travelled outside that route, whether per job or per shift. That turns straight into wasted fuel and lost time. Excess idling is picked up through engine RPM and GPS speed data. It’s worth watching because it adds fuel cost, increases emissions, and may break customer or site rules.
First-attempt delivery success is a key metric for ecommerce fleets. It is calculated as (deliveries completed on first attempt ÷ total planned deliveries) × 100. When that first attempt fails, the cost stacks up fast: a redelivery, a customer complaint, and lost driver time. In many cases, plotting failed attempts by postcode or customer type shows access or timing problems, not driver error.
How to Prioritise Metrics Across Safety, Efficiency, Compliance, and Customer Service
A practical way to manage this is to split your metrics into four groups and keep each group to three to five core KPIs.
| Category | Core KPIs to Monitor |
|---|---|
| Safety | Speeding rate, harsh events per 100 miles, seatbelt compliance, distraction/fatigue alerts |
| Efficiency | Fuel consumption per 100 km, excess idling %, off-route mileage, average dwell time |
| Compliance | Working time and drivers' hours adherence, mobile phone policy breaches, vehicle check completion |
| Customer service | On-time arrival %, first-attempt delivery success rate |
This split helps you separate hard safety limits from service targets. And that order matters. If on-time performance is getting better while speeding and harsh events are also climbing, that’s not a sign to push drivers more. It’s a sign that route plans or delivery windows need a second look. Safety metrics should set the boundary. Efficiency and service metrics sit inside that boundary.
Review the metric set every quarter. If one issue has been brought under control - for example, a spike in speeding that falls after a coaching programme - swap it out for the next job that needs attention. Keep the driver-facing scorecard short and focused on measures drivers can control, such as speeding, harsh events, idling, and on-time arrival.
How Driver Scorecards Work and How to Use Them Fairly
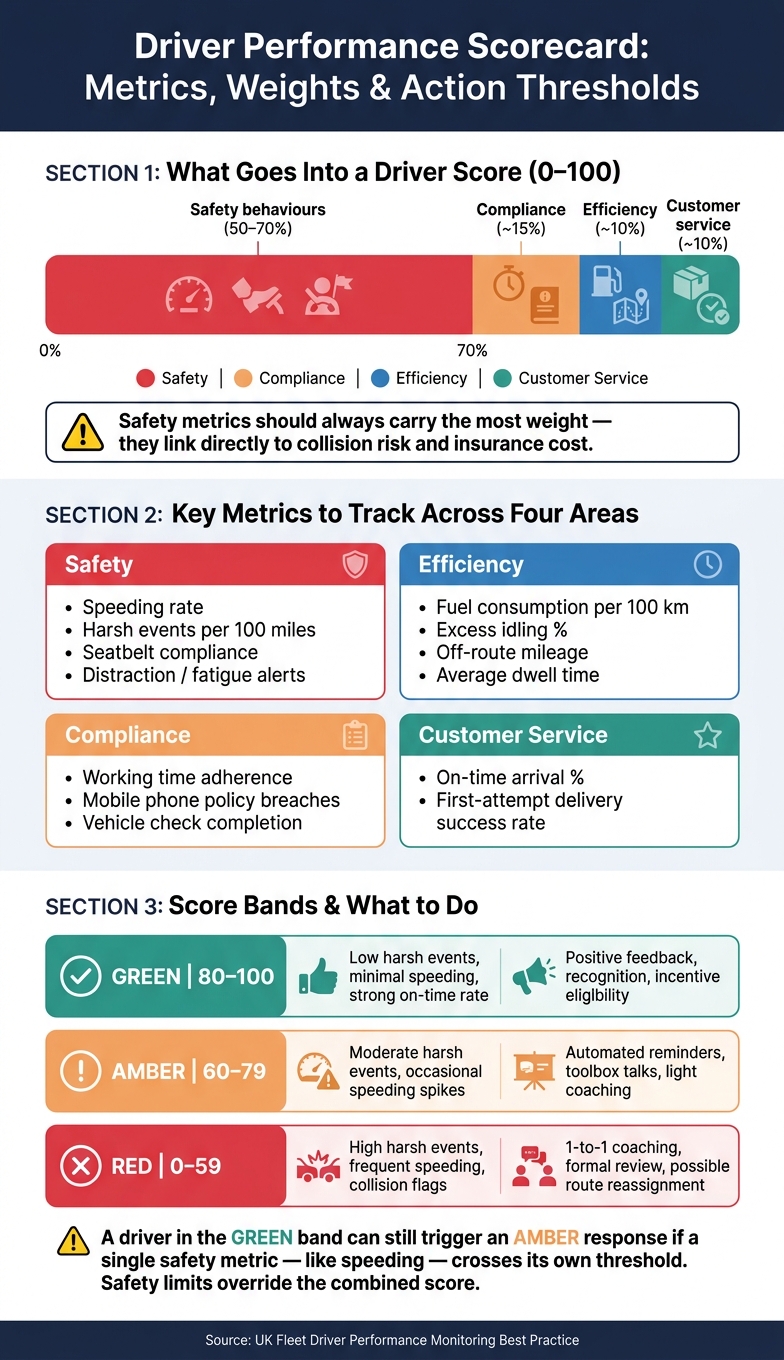
Driver Performance Monitoring: Key Metrics, Scorecard Weights & Action Thresholds
Those KPIs need to end up in one scorecard that managers can scan in seconds and drivers can use in the real world.
Building a Scorecard with Weighted Safety and Delivery Metrics
Start by turning the metrics into a single 0–100 score. Review it weekly for coaching and monthly for formal reviews.
The biggest choice is weighting. Safety behaviours should carry the most weight - speeding, harsh braking, harsh acceleration, and distraction should make up 50–70% of the total score because they have a direct link to collision risk and insurance costs.
Here’s a practical starting point:
| Metric | Category | Suggested Weight Level | Primary Data Source |
|---|---|---|---|
| Time above speed limit | Safety | High | GPS + speed-limit database |
| Harsh braking events per 100 miles | Safety | High | Telematics accelerometer |
| Harsh acceleration/cornering events | Safety | High | Telematics accelerometer |
| Collision/near-miss video flags | Safety | High | AI video telematics analytics |
| Speed policy compliance | Compliance | High | Telematics + internal policy |
| Hours within Working Time rules | Compliance | Medium | HR/timekeeping system |
| Idling time per hour | Efficiency | Medium | Engine-on/vehicle-stationary data |
| Route adherence | Efficiency | Low–Medium | Routing/dispatch system |
| On-time delivery percentage | Customer service | Medium | Delivery management platform |
| First-time delivery success rate | Customer service | Low–Medium | Delivery management platform |
Keep the scorecard tight: 8–12 metrics at most. If you pile in too many measures, the whole thing gets muddy.
It also helps to back-test the scorecard against past claims and collision records. If drivers with previous claims don’t score badly, something’s off and the weights need work.
Once the weightings are set, compare drivers only with others doing similar jobs. Otherwise, you’re not measuring driving as much as route luck.
Normalising Scores Across Different Routes, Vehicles, and Workloads
Raw event counts can be misleading. A driver in city traffic will deal with more stops, more congestion, and more risk points than someone on long trunk routes. If you compare them straight across, you end up rewarding the easier run rather than safer driving.
The fix is simple: use rate-based metrics such as events per 100 miles, per 100 drops, or per hour of driving. Then benchmark drivers against peers on similar route types, not the fleet as a whole. Group routes into profiles like urban, mixed, and trunking, then rank drivers inside those groups.
Before acting on a low score, check the basics first:
- Is the device installed and calibrated properly?
- Are the speed-limit maps current?
- Are road defects or traffic-calming features triggering false harsh-event alerts because thresholds are set badly?
If a driver disputes an event, there should be a clear review process. Look at the source data and video, remove any event that is plainly wrong, and record why it was removed. That kind of openness is what keeps the scorecard credible.
Use rolling 4–12 week averages instead of reacting to one rough week. A driver whose harsh-braking rate has climbed steadily over six weeks needs coaching. A driver who had one messy Friday probably doesn’t.
Using Scorecards for Coaching, Feedback, and Fleet Policy
Score bands help set action thresholds.
| Score Band | Typical Range | Key Trigger Metrics | Likely Interventions |
|---|---|---|---|
| Green | 80–100 | Low harsh events; minimal speeding; strong on-time rate | Positive feedback; recognition; eligibility for incentives |
| Amber | 60–79 | Moderate harsh events; occasional speeding spikes | Automated reminders; group toolbox talks; light coaching |
| Red | 0–59 | High harsh events; frequent speeding; collision flags | One-to-one coaching; formal review; possible route reassignment |
There’s an important catch here: a driver can still sit in the Green band overall and trigger an Amber-level response if one critical metric, like speeding, crosses its own limit. In plain terms, safety thresholds override the combined score.
Coaching works best when the conversation is about trends and outcomes, not just the number itself. It’s more useful to show what has improved, where the pattern is slipping, and what needs to change next. Pair the data with plain advice - brake earlier, leave bigger following gaps - and keep reviews short and regular. Monthly one-to-ones make sense for Red-band drivers, while quarterly check-ins fit amber drivers better.
At fleet level, combined scorecards can point to route-level issues. If several drivers score badly on the same route or in the same time window, the problem may be the route design itself - maybe the delivery windows are unrealistic, or the workload is packed too tightly. That’s a planning issue, not a driver coaching issue.
Any scorecard programme also needs clear rules on who can access the data, how it is explained to drivers, and how long records are kept. The same data also needs proper access and privacy controls.
Privacy, Fleet Security, and Daily Fleet Control
Privacy, Transparency, and UK Data Protection Requirements
Once monitoring data feeds into scorecards and alerts, privacy can't be an afterthought.
Driver monitoring data - including location, speed, harsh events and video - counts as personal data under UK GDPR and the Data Protection Act 2018. Most fleets base this kind of monitoring on legitimate interests or contract performance, but that only works when the monitoring is proportionate and clearly explained to drivers. If the monitoring is higher risk, or if you're using video telematics, a DPIA helps document the business case, the risks involved and the controls in place.
The driver handbook and privacy notice should explain the basics in plain English: what is recorded, when monitoring applies, who can access it, how long the data is kept, and how drivers can raise concerns or request access. Those documents should be issued at onboarding and updated whenever the system changes. Retention periods also need to stay proportionate: 6-12 months for routine journey data, 30-90 days for standard video footage, and longer only where footage is linked to an incident, claim or legal matter.
Access control matters just as much as the notice itself. In practice, that means setting the platform up so dispatchers can see live locations, safety managers can review behaviour data, and HR only sees information tied to a defined process. Audit logs should record who accessed which records and when, while role-based permissions limit what each user can view. Managers should also be trained to use telematics data for coaching and operations, not casual or non-operational sharing.
How Performance Monitoring Supports Theft Prevention and Fleet Security
The same monitoring data used for coaching can also help protect vehicles. The key is simple: use the same data for both jobs, but keep the day-to-day purpose of each one separate.
Geofencing is one of the most useful security tools for delivery fleets. You can set virtual boundaries around depots, hubs and customer sites to log arrivals and departures, then pair those with after-hours movement alerts so an unexpected ignition-on event gets flagged fast. Tamper alerts add another layer by warning you when a tracker loses power or drops offline without a clear reason.
GRS Fleet Telematics offers dual-tracker technology and immobilisation capability, with a reported 91% recovery rate for stolen vehicles and pricing from £7.99 per vehicle per month.
The table below maps common risk events to the data that usually flags them and the response a fleet team would take.
| Risk Event | Likely Data Source | Fleet Control Response |
|---|---|---|
| Vehicle theft or suspected theft | Live GPS, after-hours movement alert, tamper alert | Confirm with driver if possible; share live location with police; activate vehicle immobilisation if available; notify insurer |
| Unauthorised after-hours use | After-hours movement alert, driver ID mismatch, trip log | Contact driver to verify; log the incident; review key-control processes |
| Route deviation with high-risk stops | Route adherence data, unexpected geofence entry, extended dwell time | Check with driver for a legitimate reason; escalate if unexplained; review the trip afterwards |
| Tracker tampering | Power-loss alert, device offline inconsistent with vehicle use | Inspect the installation; if deliberate, treat it as a serious policy breach |
Turning Monitoring Data into Daily Fleet Control and Continuous Improvement
Beyond theft prevention, the same alerts also help with daily fleet control.
The main operational gain comes from managing by exception instead of watching every vehicle all day. Set alerts only for events that need action - such as critical speeding, severe braking or geofence breaches at sensitive sites - and you cut alert fatigue while keeping each intervention worth making.
Live maps work best as a support tool, not a screen to stare at nonstop. Controllers can scan for exceptions like an extended stop, a late run or a van that has missed its first-drop window. Depot geofences can automate arrival and departure logging, reduce manual check-ins and give planners better dwell-time data for later scheduling.
Over time, exception reports can show patterns that one-to-one coaching won't solve on its own. If several drivers keep scoring poorly on the same route segment or in the same time window, the problem is often route design or the delivery window rather than driver behaviour. That kind of fleet-level view helps planners refine routes, balance workloads and ease the pressure that can lead to unsafe driving.
FAQs
How is driver monitoring different from basic van tracking?
Basic van tracking shows you where a van is, whether it’s on route, and its current status. Driver monitoring goes a step further: it shows how the van is being driven.
It uses GPS, accelerometers and onboard sensors to track things like harsh braking, rapid acceleration, sharp cornering and idling. That data can then feed into driver scorecards, in-cab feedback, safer driving and better compliance.
Which driver metrics matter most for courier fleets?
The most important metrics for courier fleets are safety, compliance and efficiency.
For day-to-day fleet management, these are the numbers that matter most.
- Safety: speeding, harsh braking, rapid acceleration, sharp cornering, seatbelt use
- Compliance: driver hours, tachograph use, vehicle inspections, speed-limit adherence
- Efficiency: excessive idling, fuel consumption, route adherence
Taken together, these metrics help fleets improve driving standards, meet UK rules, cut costs and keep deliveries on time.
How can fleets monitor drivers fairly and lawfully?
Set clear, work-related rules for what you track. That can include speeding, harsh braking, harsh acceleration, idling, seatbelt use, driving hours and vehicle inspections. Then use telematics data from GPS and OBD-II sensors to coach drivers with evidence rather than hunches.
Keep comparisons fair by measuring drivers against others in the same role and under similar operating conditions. On the legal side, follow UK GDPR and the Data Protection Act 2018. Be open about what you're tracking, keep it tied to legitimate business purposes, secure the data, and offer privacy mode where it applies.