
Predictive Maintenance with Van Telematics
Spot battery, DPF, tyre and brake faults early with van telematics and turn alerts into planned repairs to cut downtime.
 By Michael Bar13 min read
I can sum this up in one line: telematics helps me spot van problems early, book repairs before a breakdown, and cut downtime that can cost UK firms £1,172.20 per van per day.
Instead of waiting for a fault or relying only on fixed service intervals, I use data like mileage, engine hours, fault codes, battery voltage, temperatures, tyre pressure, braking events, idling and route type to see when a van is starting to wear out. That means I can move work from roadside failures and last-minute callouts to planned workshop visits.
Here’s the article in simple terms:
- Reactive repairs start after something fails
- Time-based servicing follows the calendar or mileage
- Predictive maintenance starts when vehicle data shows early warning signs
- City vans often need closer checks for DPF, oil, brakes and tyres
- Motorway vans may be able to go longer between some service jobs
- Repeated patterns matter more than one-off alerts
- Clear rules matter: what gets flagged, who checks it, and when the van gets booked in
- Key KPIs include downtime, maintenance cost per mile, planned service completion, time between failures and repeat faults
A few warning signs stand out:
- Battery: falling resting voltage, deeper dips at start-up
- Brakes: more harsh braking events, more brake effort over time
- Tyres: one wheel losing pressure again and again
- DPF: more regenerations and repeat DPF fault codes
- Cooling: temperatures creeping above the van’s normal baseline
- Suspension and steering: repeated impact events, vibration, steering fault codes
| Approach | What starts the action | Main downside |
|---|---|---|
| Reactive repairs | Fault or breakdown | High repair cost and unplanned downtime |
| Time-based servicing | Set date or mileage | May service too early or too late |
| Predictive maintenance | Vehicle condition data and alert patterns | Needs clean data and set alert rules |
The core idea is simple: if I track the right signals, set the right thresholds, and turn alerts into workshop bookings, I can keep more vans on the road and avoid many emergency repairs.
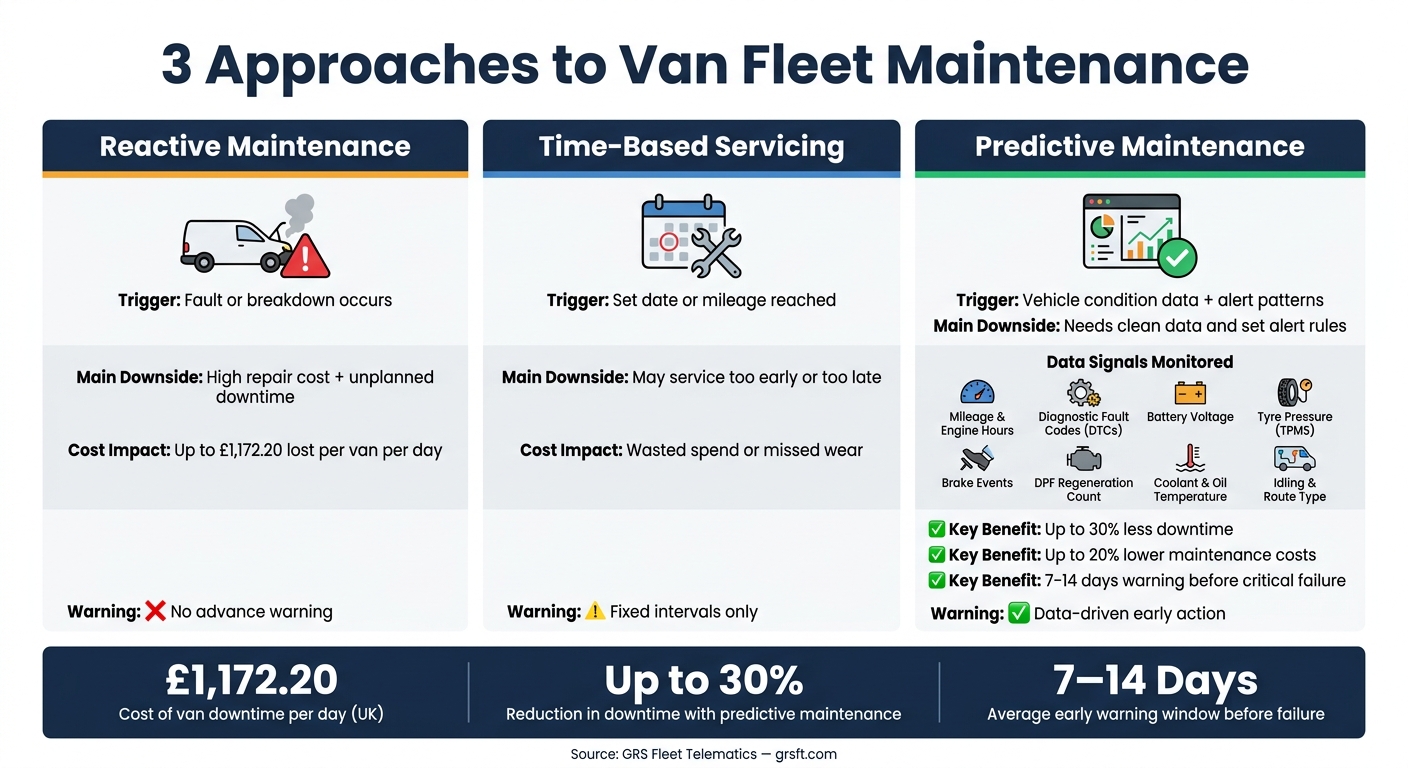
Predictive vs Reactive vs Time-Based Van Maintenance: Key Differences
What van telematics data helps predict maintenance issues
Telematics brings mileage, engine hours, fault codes and sensor data into one dashboard, so early signs of wear show up before they turn into a roadside failure. By connecting to the vehicle's OBD-II port or CAN bus, it feeds vehicle data into a cloud platform for trend analysis. The point isn't just having more data. It's spotting the signals that hint at trouble early.
Mileage, engine hours and diagnostic fault codes
Mileage is useful for setting automatic service reminders, but on its own it only tells part of the story. It doesn't show how hard the engine has been working. A van doing stop-start city rounds can wear out faster than a motorway van showing the same mileage, which is why engine hours need to sit alongside mileage when setting service intervals. Put simply, mileage shows use; engine hours show workload.
Diagnostic trouble codes (DTCs) add a second layer. These are fault codes created by the vehicle's electronic control units when sensors pick up something outside normal limits. Telematics brings those fault codes to the surface early, often before a warning light appears.
That early view matters. If a van keeps showing DPF efficiency codes during short urban runs, that's a sign of blockage risk. The fleet can then deal with it through planned DPF cleaning, a forced regeneration or a longer motorway run instead of waiting for an unplanned breakdown.
Battery voltage, temperatures, tyres and braking events
Battery voltage is one of the clearest early warning signs available through the CAN bus or direct wiring. If a van keeps dropping below 12.0 V on cold mornings, it's likely carrying a weak battery that may fail once winter temperatures fall even more. Set an alert for repeated low-voltage events over seven days, and managers can book in a battery test during planned downtime instead of dealing with a non-start at the beginning of a busy shift.
Coolant and oil temperature trends also help. In normal use, temperatures rise steadily, settle into a stable range and stay there. If a van regularly runs hotter than others in the fleet, or spikes on congested urban routes, that may point to a partly blocked radiator, a failing thermostat or restricted airflow.
For tyres and brake wear, telematics pulls in both TPMS pressure data and behaviour data from GPS and the CAN bus. Harsh braking speeds up pad and disc wear. Under-inflated tyres increase blowout risk and fuel use. When TPMS readings are looked at alongside driving behaviour, managers can see which vans need earlier tyre or brake checks, and which drivers may need focused coaching.
Idling, stop-start driving and route conditions
Telematics tracks idling, stop-start cycles and trip length. That matters because high idling and short trips are closely tied to DPF problems in diesel vans. Diesel particulate filters need sustained exhaust heat to burn off soot, and city multi-drop work often doesn't create enough of that heat. So when telematics shows high idle time, short average trip lengths and recurring DPF-related fault codes on the same van, that's a clear sign to plan DPF cleaning or schedule a longer run to clear the filter.
The same duty cycle also speeds up oil degradation. Frequent stop-start work puts oil through more thermal cycles and increases fuel dilution, which means city vans may need oil changes sooner than mileage alone would suggest. UK fleets can use this data to split service schedules, with shorter intervals and more frequent DPF and EGR checks for city vans, while stretching intervals for vans that spend most of their time on free-flowing motorway routes. The next section shows how these signals map to specific wear patterns.
How data patterns reveal wear and common van failures
One fault code on its own doesn't tell you much. What matters is the pattern: repeated alerts, small shifts in readings, and trends that keep turning up over 30, 60 or 90 days. That's where wear starts to show itself. Once you spot the pattern, you can link it to the part that's starting to fail.
Patterns that point to battery, brake, tyre and DPF problems
Battery trouble often shows up long before a van refuses to start. A slow drop in resting battery voltage, paired with a higher alternator charging voltage, usually points to a battery that's starting to wear out. If that pattern keeps appearing over a few weeks, fleets can often step in 30–60 days before failure. And if a van drops lower than normal during morning starts, especially in winter, it should be flagged for a battery load test before it leaves a driver stranded.
Brake wear tends to appear in driving behaviour data. If harsh braking events per 1,000 miles keep rising on the same vehicle, pad and disc wear is often speeding up too. An even stronger sign is when the van needs more brake effort to stop in the same way. That trend can give about two to four weeks of warning before pads hit their wear limit. Catch it then, and you can book the van into the workshop instead of dealing with an urgent repair.
Tyre data has its own tell-tale signs. If one wheel keeps losing pressure compared with the others on the same axle, that's a red flag. Repeated low-pressure alerts on the same tyre, even after the driver tops it up, often point to a slow puncture or a valve fault that needs fixing properly. A tyre that runs hotter than the others at the same speed can also point to under-inflation or misalignment, both of which wear the tread faster.
When regeneration attempts start climbing at the same time as recurring DPF fault codes, the filter isn't clearing as it should and needs planned maintenance.
Cooling, suspension and steering warning signs
Cooling faults usually build slowly rather than all at once. If a van's operating temperature starts creeping above its normal baseline across similar trips and similar loads, it may point to a partly blocked radiator, a weakening water pump, or a thermostat that's starting to stick. Repeated overheating alerts in normal driving, especially when fault codes appear too, are a much stronger warning. Left alone, that can end in head gasket failure or engine seizure.
Telematics accelerometers can also reveal the sort of punishment a van takes day after day. Repeated hits from potholes, speed bumps and kerb strikes speed up wear on shocks, springs, bushes and steering joints. UK MOT guidance highlights insecure suspension parts, worn rubber bushes, fractured leaf springs and power steering leaks as common test failures. So if a vehicle is running heavy loads on rough roads and logging frequent high-impact events, it should move up the queue for a suspension and steering check before its next scheduled service.
Common parts, warning patterns and pre-emptive action: comparison table
The table below links common failure-prone parts in UK van fleets with the warning patterns seen in telematics data, what can happen if they're ignored, and the most sensible early response.
| Component | Telematics warning pattern | Likely failure outcome | Recommended early action |
|---|---|---|---|
| Battery | Resting voltage declining over time; deeper cranking dips; rising charging voltage | No-start; roadside breakdown | Battery load test; replace during planned visit |
| Brake pads & discs | Rising harsh braking rate; increasing brake effort for the same deceleration; elevated brake temperatures | Reduced braking performance; MOT failure; disc damage | Inspect pads and discs; check callipers; driver coaching |
| Tyres | Gradual pressure loss on one wheel; repeated low-pressure alerts; higher tyre temperature than the others | Blowout; uneven tread wear; poor fuel economy | Check for slow puncture or valve fault; inspect alignment |
| DPF & exhaust | Rising regeneration count; recurring DPF fault codes | Soot saturation; engine derate; costly DPF replacement | Schedule DPF clean or longer burn-off run; review duty cycle |
| Cooling system | Gradual upward temperature drift vs. baseline; repeated overheat alerts; coolant fault codes | Overheating; head gasket failure; engine seizure | Check coolant level, leaks, thermostat, radiator and pump |
| Suspension | Frequent high-impact events; abnormal vibration patterns at certain speeds | Worn shocks, broken springs, failed bushes; poor handling | Prioritise inspection; replace worn components in planned slot |
| Steering | Repeated steering-related DTCs; abnormal movement; power steering fault codes | Loss of handling precision; MOT failure | Check steering rack, joints and power steering fluid |
These patterns only matter if they lead to action: a booking, an inspection, and a follow-up check once the work is done.
How fleet managers can build a telematics-led maintenance routine
Spotting warning signs is only half the work. The next step is turning those signs into a process your team can follow every time.
Choose the right vehicles, signals and alert thresholds
Start with the warning patterns above and turn them into your first alert rules. Build a consistent profile for each van that links the registration, VIN, make and model, age, odometer and telematics device ID to its workshop record. Add service history, MOT dates, replaced parts and logged defects so you can check alerts against what has already happened.
It also helps to match telematics mileage with workshop mileage every 3–6 months before you lock in thresholds. Use the same naming convention across the telematics platform, maintenance system and spreadsheets. Then run weekly checks for devices that are not transmitting or vans showing impossible mileage jumps. If the data is messy, the alerts will be messy too.
From there, focus on the signals that matter most first:
- Mileage
- Engine hours
- Diagnostic trouble codes (DTCs)
- Battery voltage
Mileage and engine hours should trigger inspections based on the manufacturer's service schedule. A simple rule works well: set an alert at around 90% of the recommended interval so you have time to book a quieter workshop slot. If a van has a 20,000-mile service interval, set the alert at 18,000 miles. That gives you some breathing room before the vehicle becomes overdue.
For DTCs, split the urgent from the routine. Critical codes, such as engine misfires, ABS faults and DPF blockages, should lead to immediate action. Minor sensor codes can be reviewed in batches. Start with your fleet history, then fine-tune using manufacturer guidance. If your vans spend most of their time in city traffic, you may need shorter intervals because stop-start use tends to create more wear. Over the first 6–12 months, keep adjusting the thresholds so they reflect how the vans are used in day-to-day work.
Once your thresholds are live, each alert should lead straight to a booking rule.
Turn alerts into workshop bookings and job planning
Alerts mean nothing if they do not create a job card and a workshop slot. Each one should link to a clear standard operating procedure (SOP), such as inspection only, component test, planned replacement or safety-critical repair. That stops alerts from turning into background noise and makes each person's role clear. Book service alerts within 7 days. For critical DTCs, the rule should be simple: stop the van and call maintenance.
Use live GPS data alongside planned route schedules to spot natural service windows. That could be when a van is between jobs, near base or on a lighter day. Looking at location and schedule together also helps you avoid clashing with booked delivery slots.
Once an alert comes in, pre-order common parts like batteries, brake pads, filters or sensors. Send the technician a short brief with the fault code and the vehicle's recent operating context. That way, when the van arrives, the workshop already has the job card and parts lined up. Less waiting around. Less time in the bay.
The next step is checking whether those alerts are cutting downtime instead of just adding more admin.
Measure downtime, cost per mile and repeat faults
A small set of KPIs will show whether the routine is doing its job. Tie each one back to downtime, cost per mile and repeat faults so you can see if breakdowns are falling and vehicle availability is improving. Review them every quarter and compare them with your pre-implementation baseline.
| KPI | Formula | Target |
|---|---|---|
| Vehicle downtime % | Downtime hours ÷ Total available hours × 100 | <10% total; <3% unplanned |
| Maintenance cost per mile | Total maintenance cost ÷ Total miles driven | Monitor for a downward trend over time |
| Planned maintenance compliance rate | Planned maintenance tasks completed ÷ Planned maintenance tasks scheduled × 100 | ≥95% |
| Mean time between failures (MTBF) | Total operating hours ÷ Number of failures | Rising MTBF = improving reliability |
| Repeat defects | Same fault on the same van within 3–6 months | Aim for zero; high rates signal poor diagnosis |
GRS Fleet Telematics supports this process with continuous van tracking, driver analytics - including harsh braking, acceleration and idling data - and fleet visibility dashboards that give managers the real-time picture they need to coordinate bookings, monitor usage patterns and catch faults before they turn into bigger problems.
Conclusion: Using predictive maintenance to reduce cost and downtime
Telematics helps spot early wear. Pattern data shows where faults are starting to form. And a clear workflow turns alerts into booked, planned repairs.
What changes when maintenance becomes data-led
When alerts connect straight to workshop bookings, the impact shows up fast: fewer emergency repairs and better vehicle availability. Studies link predictive maintenance to up to 30% less downtime, up to 20% lower maintenance costs, and 7–14 days of warning before a critical failure. For UK fleets handling early-morning deliveries or time-sensitive service routes, that warning window can mean the difference between a planned vehicle swap and a cancelled job.
Reactive maintenance waits for a dashboard warning light. Predictive maintenance gets the van booked in before the failure happens. That cuts call-outs and reduces unplanned downtime.
Many fleets start seeing results within 30–90 days, with fewer breakdowns and steadier workshop planning as alert rules are adjusted. Over time, this way of working can also improve MOT pass rates and make workshop demand easier to plan. For UK operators dealing with tight schedules and compliance duties, that matters.
That’s the practical outcome of predictive maintenance: fewer surprises and more vans ready when work needs them. GRS Fleet Telematics provides van tracking and utilisation data that helps managers spot risk early and plan maintenance more efficiently.
FAQs
How does telematics predict faults early?
Telematics can flag faults early because it keeps pulling in live data from a van’s engine control module and onboard sensors.
It then uses AI and machine learning to spot patterns that point to wear and tear, like odd vibrations, climbing engine temperatures, or shifts in fuel use. When that data passes set thresholds, the system sends an alert. That gives managers time to schedule repairs before the van breaks down.
Which vans benefit most from predictive maintenance?
Predictive maintenance works best for vans that are under heavy day-to-day strain. That includes heavy-duty urban stop-start delivery vans, short-distance urban vans that spend a lot of time idling, and vans used on construction sites.
These vehicles often rack up high engine hours even when their mileage looks fairly low. That’s why mileage alone doesn’t tell the full story. With GRS Fleet Telematics data, such as engine load, battery voltage, and brake patterns, fleet managers can spot signs of wear early and plan repairs outside productive service times.
How long does it take to see results?
Usually, it happens fast. Telematics platforms send real-time diagnostic alerts, which can cut reporting time from days to seconds. So the moment the data feed is live, the value starts to show.
For many fleet operators, the return on investment comes within 6 to 12 months, often through lower running costs. In plenty of cases, alerts come through 7 days or 1,000 miles before an expected issue, then again at 3 days or 200 miles with a follow-up.