
How Telematics Tracks Construction Fleet Accidents
How GPS, timestamps, speed, impact alerts and video combine to reconstruct and report construction fleet accidents.
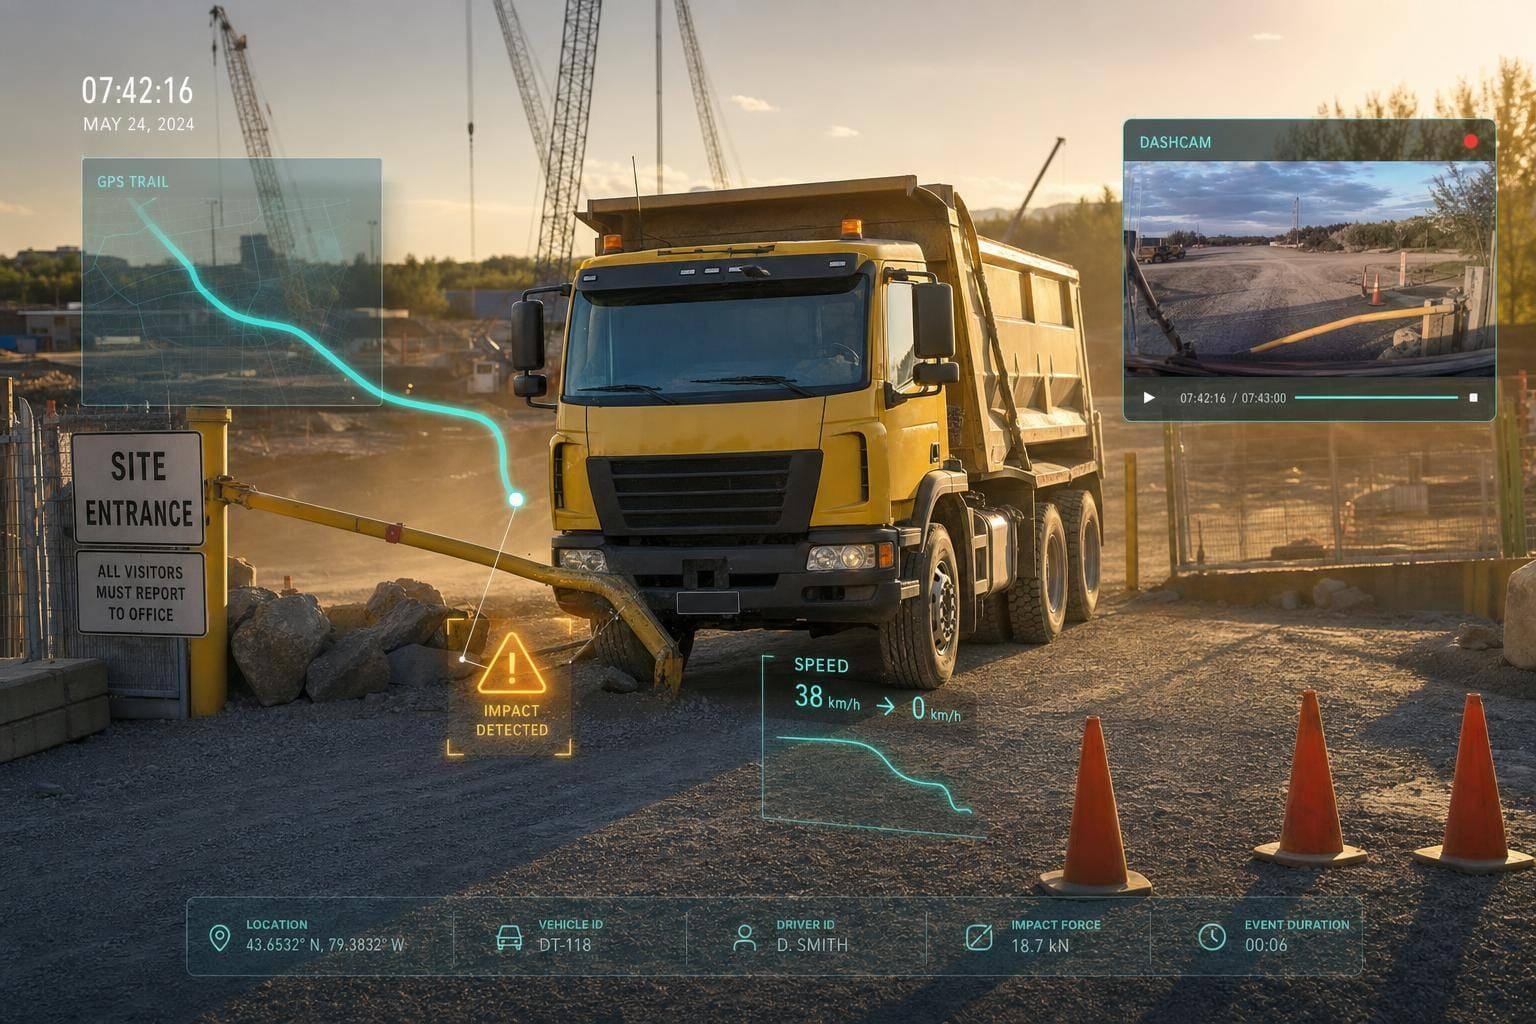
If I need to work out what happened in a fleet accident, telematics gives me the main facts fast: who, what, when, where, and how. It does that by linking GPS location, time stamps, speed and braking data, impact alerts, and video footage into one record.
Here’s the short version:
- I can see the exact time and place of the incident
- I can check whether it happened on a public road or on site
- I can review what the vehicle was doing before and after the impact
- I can match alerts and movement data with camera footage
- I can turn that into one clear report for insurers, managers, or safety checks
- I can then use past incidents to spot repeat trouble areas, such as a site entrance or a route used at the same time each day
A few details matter straight away. Some systems flag hard braking at more than 6 mph per second or 0.265g for at least one second, and footage may be overwritten in 24–48 hours if I do not save it in time. That means the first steps are simple: check the alert, confirm the location, review the timeline, save the footage, and export the evidence.
In other words, telematics does more than log a crash. It helps me piece together the event, write a clear report, and use past records to cut risk across the fleet.
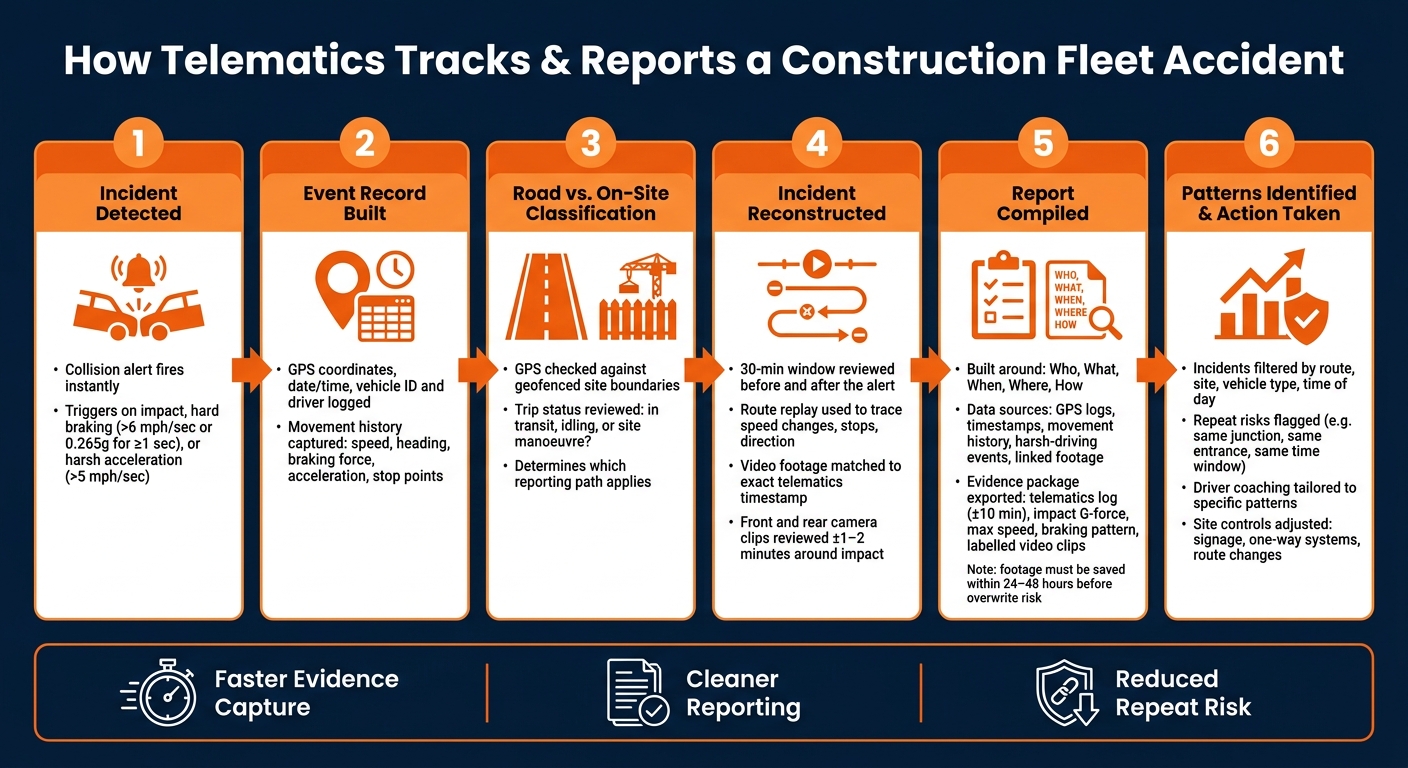
How Telematics Tracks & Reports a Construction Fleet Accident
How Fleets Reconstruct Accidents in Minutes Using Telematics | Geotab Xtract
What Telematics Records at the Moment of an Accident
When an incident happens, telematics builds a full event record. It covers the vehicle, location, time and the sequence of movement. The next job is to read the location data, movement trail and footage together so the full picture starts to make sense.
Location, Time Stamp and Vehicle Identity
The system logs the GPS position, date and time, along with the registration number, fleet ID and assigned driver. When those coordinates are mapped against site boundaries and geofenced zones, it becomes much easier to see whether the vehicle was on a public road or inside a site compound at that moment. That matters, because it can change which reporting process applies.
Movement History Before and After the Event
After the location and vehicle details are confirmed, the movement trail shows how the incident unfolded. The key part is the seconds just before and after the impact. Speed, heading, braking force, acceleration and stop points all feed into that history, showing how the vehicle was being driven in the run-up to the event - and whether it moved afterwards.
A steady speed followed by sudden deceleration can point to one type of incident. A controlled stop with movement after impact can point to another. That difference matters when you're trying to work out what happened, not just where it happened.
Linked Footage and Event Evidence
The record becomes much stronger when video is matched to the telematics timeline. Footage is tied to the same vehicle, time and location record, so reviewers aren't left guessing. Some systems pull clips from both front and rear cameras, triggered by the collision event, and record several seconds on either side of the impact.
That gives a visual account of the lead-up, the moment itself and the immediate aftermath - all lined up with the telematics timeline.
How to Detect an Accident Using Telematics Data
Once the event record is in place, telematics helps you spot which incidents need fast attention. It pushes alerts as soon as a serious event shows up, so managers can check the evidence while it’s still fresh.
Collision Alerts and Harsh-Driving Triggers
Telematics doesn’t rely on a single trigger. It looks at several signals at once. Collision alerts point to heavy impacts, while harsh braking, rapid deceleration and harsh cornering can point to near-misses or sudden evasive manoeuvres.
Some systems work from set speed and force thresholds. Hard braking, for instance, can be flagged at more than 6 mph per second of deceleration or at 0.265g for at least one second. Harsh acceleration can trigger at more than 5 mph per second. Once a threshold is crossed, the system logs the alert and may notify the fleet manager.
What carries the most weight is the pattern, not just one warning on its own. A collision alert paired with a sharp drop in speed and an instant stop is much more convincing than a lone harsh-braking flag. That kind of sequence suggests the vehicle came to a sudden, unplanned halt and needs checking straight away.
The next job is to work out whether the alert happened on the road or inside a site boundary.
Telling Road Incidents Apart from On-Site Events
Construction vehicles move between public roads and sites, where low-speed knocks, tight manoeuvres and rough ground are part of the day-to-day.
Start with the map position. If the GPS coordinates show the vehicle inside a geofenced site boundary when the alert fired, the event is likely to be on-site. Then check trip status: was the vehicle in transit, idling or carrying out a site movement? Timing adds the last piece. An alert during a delivery run means something different from one that happens during loading or yard manoeuvring.
Put together, these data points help classify the incident before reporting starts. On-site events and road incidents go down different reporting paths.
sbb-itb-499a7f0
How to Reconstruct an Incident for Reporting
Once you've classified the incident, the next job is to build a clear, ordered account of what happened. Go through the records in sequence so you can piece together the timeline without gaps. The road-or-site label from the previous step helps here too, because it tells you which logs and footage to check first.
Review Trip History, Map Replay and Event Timeline
Start with the event timestamp, then work outwards. Set a time window - usually 30 minutes before and 30 minutes after the alert - and filter the platform to the right vehicle and date. Then use the route replay tool to follow the vehicle's movement on the map, paying attention to speed changes, stop points and any change in direction along the route.
From there, build the timeline minute by minute. Say the replay shows a van entering a site at 09:14, idling for three minutes near a loading bay, reversing slowly at 3–5 mph, and then logging a harsh braking and impact alert at 09:19 at a set coordinate. That gives you a usable sequence, not just a single alert. Match the route against the planned job so you can explain why the vehicle was there in the first place.
It also helps to layer event markers - harsh braking, speeding and impact alerts - over the route history. That makes it easier to pin down the exact moment of the incident and the type of event the system recorded.
Match Telematics Records with Linked Footage
Once the route timeline makes sense, line it up with the video clip. Take the exact timestamp from the log, then jump to that point in the footage. Watch 1–2 minutes on either side of the event so you can see the lead-up and the immediate aftermath.
Many current systems let you click straight from an event in the log to the linked video clip, which cuts down the chance of mismatch between the record and the footage. This is often the point where disputed versions of events fall apart. If a driver says they were within the speed limit, the telematics speed log and the road signs visible in the footage can back that up or show the opposite. If a site manager disputes the vehicle's location, the GPS position and camera view usually settle it.
Each record fills in one piece of the incident sequence.
| Telematics record | What it adds to reconstruction |
|---|---|
| Trip history / route map | Shows where the vehicle travelled before and after the incident |
| Event timeline / speed profile | Shows acceleration, braking and timing around the crash |
| GPS timestamp | Anchors the incident to an exact time and location |
| Linked footage | Shows road conditions, traffic, signals and driver behaviour |
| Driver and dispatch logs | Explain why the vehicle was there and what job was underway |
How to Turn Telematics Data into a Practical Accident Report
Once you've pieced the incident together, the next job is simple: turn it into one clear report. Pull GPS logs, time stamps, movement history, harsh-driving events and linked footage into a single record. Then use that record to fill in the report fields below.
Build a Report Around Who, What, When, Where and How
A good accident report doesn’t need fluff. It needs the right facts, in the right order. Build it around five headings:
- Who: vehicle, driver, asset ID, job code
- What: incident type and severity, backed by the trigger and G-force
- When: exact time stamp in 24-hour format and DD/MM/YYYY, such as 14:37 on 10/08/2026
- Where: road name, junction, postcode or site zone
- How: speed, braking, direction and linked footage
Each field should come from one telematics source or event log. That keeps the report aligned from top to bottom and cuts the risk of mismatched details.
| Data source | What it proves | Why it matters |
|---|---|---|
| Location data (GPS) | Exact vehicle position at and around the incident | Shows whether the vehicle was on-road, on-site or in a restricted area |
| Time stamps | Precise timing and sequence of events | Anchors the incident for insurers, legal review and cross-referencing with witness accounts |
| Movement history | How the vehicle was driven before and after the event | Reveals behaviour trends and distinguishes sudden impacts from gradual loss of control |
| Harsh-driving events | Specific risky manoeuvres or impacts | Provides objective evidence of driver behaviour and impact severity |
| Linked footage | Visual confirmation of conditions and actions | Clears up unclear data and shows road conditions, signage and third-party behaviour |
Preserve and Export Evidence Efficiently
This is where automatic capture does the heavy lifting. When a collision alert fires, the system saves the relevant data and footage on its own. That matters because camera footage can be overwritten within 24–48 hours if it isn't secured promptly.
Because the core facts are already stored digitally, you can build the report without typing everything in again. That cuts transcription mistakes and keeps the format the same across every incident, no matter which site or project is involved.
When it’s time to share the record, export one package. It should include the telematics log covering at least 10 minutes before and after the event, the event-level data such as impact G-force, maximum speed and braking pattern, plus labelled clips with file name and time stamp.
That way, insurers and compliance teams can review the same structured record without coming back for missing details. It also gives you a cleaner record for repeat-risk review.
How to Use Accident Data to Improve Fleet Safety
A completed accident report starts to matter when you compare it with other incidents and look for repeat patterns. Once the report is done, check incidents across vehicles, sites, and times of day.
Identify Repeat Risks Across Routes, Sites and Times of Day
When you’ve logged several incidents in the same format, patterns are much easier to see. You might notice harsh braking near the same junction again and again, repeated collision alerts at one site entrance, or several events during early-morning runs. When the same issue keeps showing up, treat it as a route or site risk.
Use filtered reports and map views to see where incidents repeat. If three drivers log harsh-braking events on the same approach road every week, the issue is probably the road or the route. If incidents bunch up during early-morning or late-afternoon delivery windows, that can point to poor visibility or congestion near site access points. Looking at route, depot, site entrance, vehicle type, and time of day helps managers decide which risks to deal with first, instead of treating every event as a one-off.
That’s why monitoring works best when managers act on the patterns it shows.
Once the pattern is clear, use it to change driver behaviour or site controls.
Use Findings to Coach Drivers and Adjust Routes
Use the pattern to guide coaching and route or site changes. Coach to the pattern, not the rule. Show a driver that their harsh-braking events keep happening on the same stretch of road at the same time of day, then agree on a practical change - a lower approach speed or a different route.
The same idea applies at site entrances. If location data and movement history show repeated low-speed impact alerts at one entrance, that’s a reason to review the traffic management plan: revised signage or a one-way system. The location, time stamp, movement history, harsh-driving events, and footage already gathered in the report are what shape those changes - to routes, site controls, and driver behaviour.
FAQs
How accurate is telematics after a crash?
Telematics can paint a very accurate picture of what happened after a crash by pulling together several data streams. GPS logs the vehicle’s location and time stamps, while accelerometers record the force and direction of the impact.
When the system is triggered, it can also log speed, braking, throttle use, seatbelt status and linked dashcam footage. For fleet managers, that means clear, objective evidence that can help pinpoint driver error, mechanical failure or outside conditions.
What should I save first after an accident alert?
First, prioritise the First Notification of Loss (FNOL) within 24 hours. Acting fast can help cut third-party capture costs and bring down overall claim spend.
At the same time, secure and export the linked telematics evidence: timestamped location, speed profile and any associated video footage. This gives you a clear record of what happened, helps guard against fraudulent claims, and supports insurance reporting and internal incident reviews.
Can telematics help prevent repeat accidents?
Yes. Telematics helps stop repeat accidents by shifting fleet management from reactive to proactive.
It logs data like speed, harsh braking, and location, which helps managers spot recurring risk patterns tied to certain drivers or routes.
That gives managers clear, objective evidence for focused coaching. And with real-time in-cab alerts, drivers can correct unsafe behaviour in the moment instead of after the fact.